My Astro Pi entry.
My Python program was run for 2 and a half hours on the ISS, this repo contains the data and programs associated with that flight.
The photos taken on flight and a video of them all strung together is available at https://jayhal.es/vault/astro-pi.
At the current time the CSV file of the initial data, including longitude and latitude, has been converted into JSON and a crude HTML5 canvas project was created but suffered from performance issues when loading in the large amounts of images. If you download and unzip the images into a cloned repository the .gitignore file will not attempt to commit or push the files. Note the file must be called "images".
Download and unzip the file: https://jayhal.es/vault/astro-pi/compressed-images.zip into a file called images in the repo.
The below image is the current state of the image rendered by the Python program creating the flightpath of the ISS. At scale x0.1.
Note: The dark section are during the night and the yellowish frames before and after these sections are due to reflection from the sun hitting the casing at the wrong angle. You might want to open the image in a new tab as its very large so you can zoom and explore at your own leisure.

The project originally began with an attempt to use 4 band images, RGB and near infrared, and cross reference the data obtained via NVDI with pollution levels of the surrounding area and observe the effect that it had on plant life. However, due to my own sole mistake I managed to take the photos with no near infrared band, rendering our entire project useless. Rather than give up on the project I decided to change the direction and work on compiling all 2,500 images into a collage in their correct positions (and rotations I would later find).
The first part of this write up will contain the journey I went on to get to my current situation.
Having already released my mistake on capturing the wrong file type I got to work attempting to compile all the images into a stop motion video. I played around in JS canvas, an environment I was already very comfortable with, for a while attempting to make a video I could later capture. I immediately ran into issues of loading the images into memory and latency in rendering them. After experimenting with JS workers and moving to a local server the loading times became unusable. Having to load them across network as well only made these issues worse.
I eventually put them all into Premier Pro to just create a video I could share with my family and friends.
I then used Python to convert the CSV data I captured during runtime to JSON which most languages have simpler support for and seeing as it was early days still I still didn't know what language I would ultimately be using.
I then moved to Python, drawn by the PIL module and a strong foundation in the language. I immediately released that there was no way I could ever hope to accurately position the images without knowing the scale of the images. Attempts to find the FOV of the camera were inconclusive, with not enough evidence to support basing the whole project of. With the FOV some basic trigonometry could have revealed the scale of the images. The next solution presented itself in the city of Dakar.
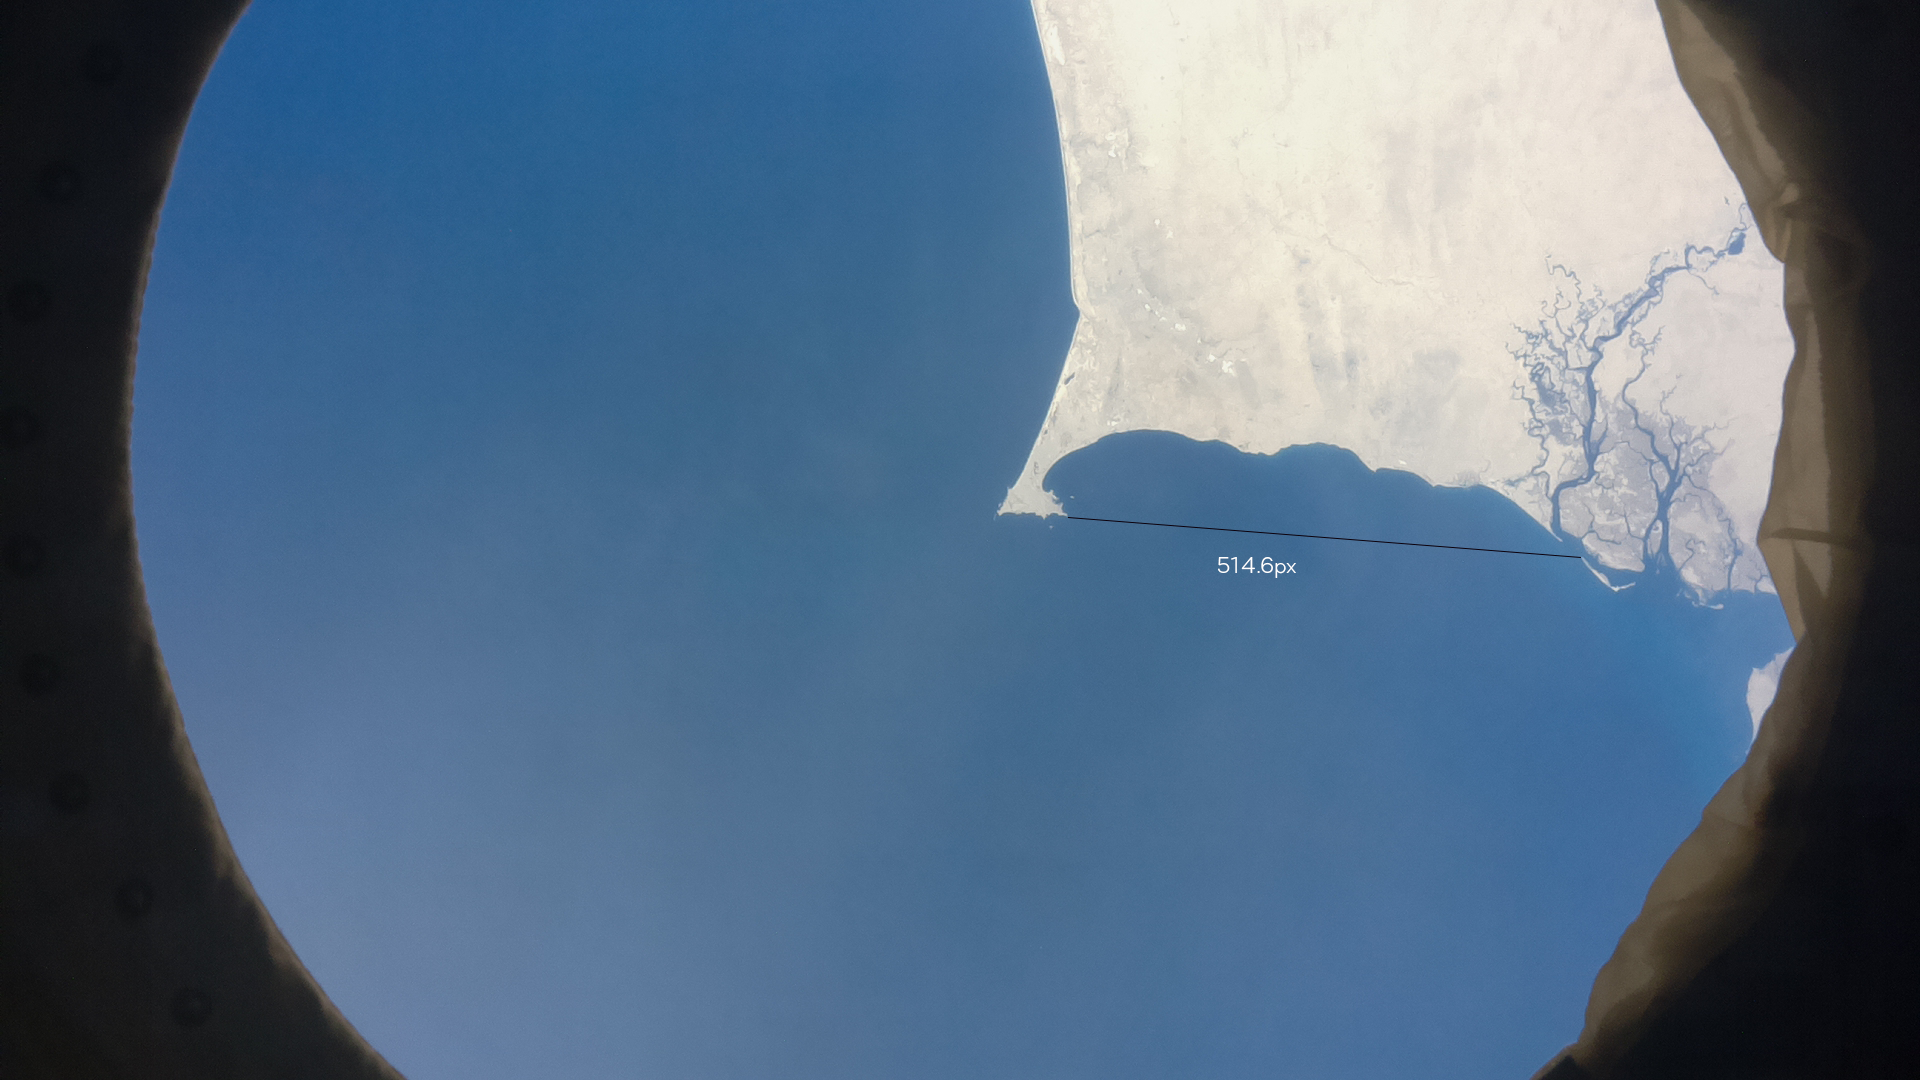
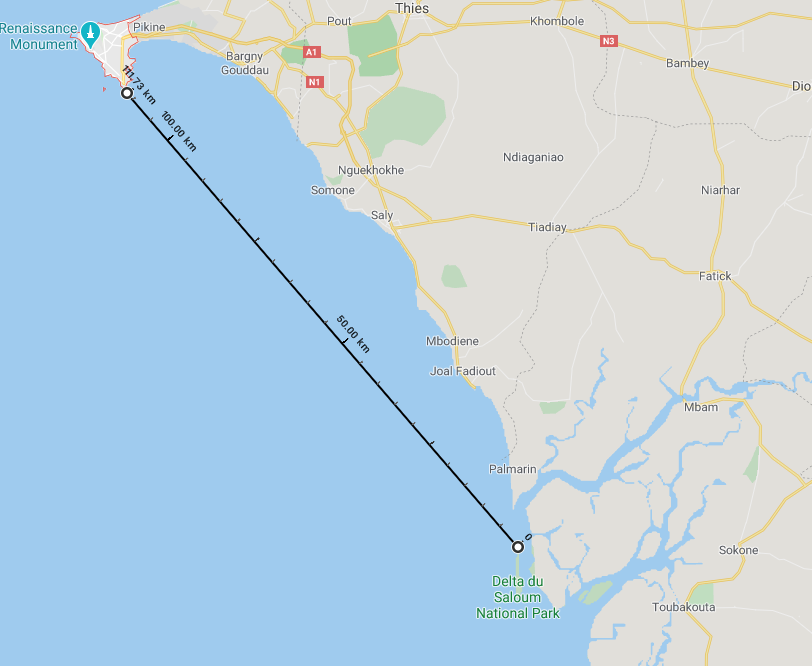
On of the most prominent landmarks in all of the frames is the city of Dakar, a spit of land protruding from the country of Senegal. With multiple sharp edges and key points it was an optimum place to attempt to find the scale of the images. Using the distance between the most southern part of the peninsular and the most northern top of close island I found the distance to be 514.6 pixels. Using the Google maps distance measurer tool the distance between the two points was 111.73km.
514.6 / 111.73 = 4.60575. Therefore 4.60575 pixels per km.
1 minute is one nautical mile so 1 degree = 60 nautical miles.
1852 * 60 = 111.12 Therefore 1 degree is 111.12km.
4.60575 * 111.12 = 511.79094 Therefore 512.71209 pixels per 1 degree.
The reciprocal gives us 0.00195 degrees per pixel.
Note: All of these numbers were rounded to 5 decimal places.
After calculating these constants I assumed it would be plain sailing from then on. Opening Python and multiplying the longitudes and latitudes by 511.79094 would have positioned all the images in the correct places. A number of problems immediately presented themselves. Firstly, the final images, if the resolutions of the initial images were left unchanged would have been 184680px by 51300px, far to great to be stored in memory when working with it. Introducing a scale factor fixed the issue and I began working at x0.1 scale.
The images were positioned correctly on the X and Y but I noticed they were not angled corretly. Having already made a strip of the images all together I noticed that to make them all fit the Y value at which they were positioned at must be 0. This is because while we think about maps and other diagrams on a two dimensional plane the path appears to be a wave but in reality the ISS does not travel in a wave like manner but just traveling at a constant speed in a single direction. To make the images fit into the iconic wave pattern often exhibited when talking about the ISS I released that they must be rotated to the correct angle. The simplest way to do this was to make them point towards the image behind them. This would generate the correct shape wave.
Using the arctan2 function to find the angle between each images, I rotated them about their centre point.
The moment when I opened the saved image all the images fitted seamlessly together was an amazing moment. It took me away to consider the scale of which my screen was containing. The entire great circle of the earth, twice, drawn in HD on my screen. Normally I'm a very down to Earth person but this blew me away.
Following this I rendered all 2,501 images rather than the small set I was working with and after about 10 minutes the first fully correct image was made. After this I worked on small bug fixes and slight discrepancies. My PCs RAM has stopped me rendering the image at any higher resolutions.

