- Introduction
- Installation
- Using TreeProfiler
- Annotate metadata into tree
- Plot annotated tree with layouts
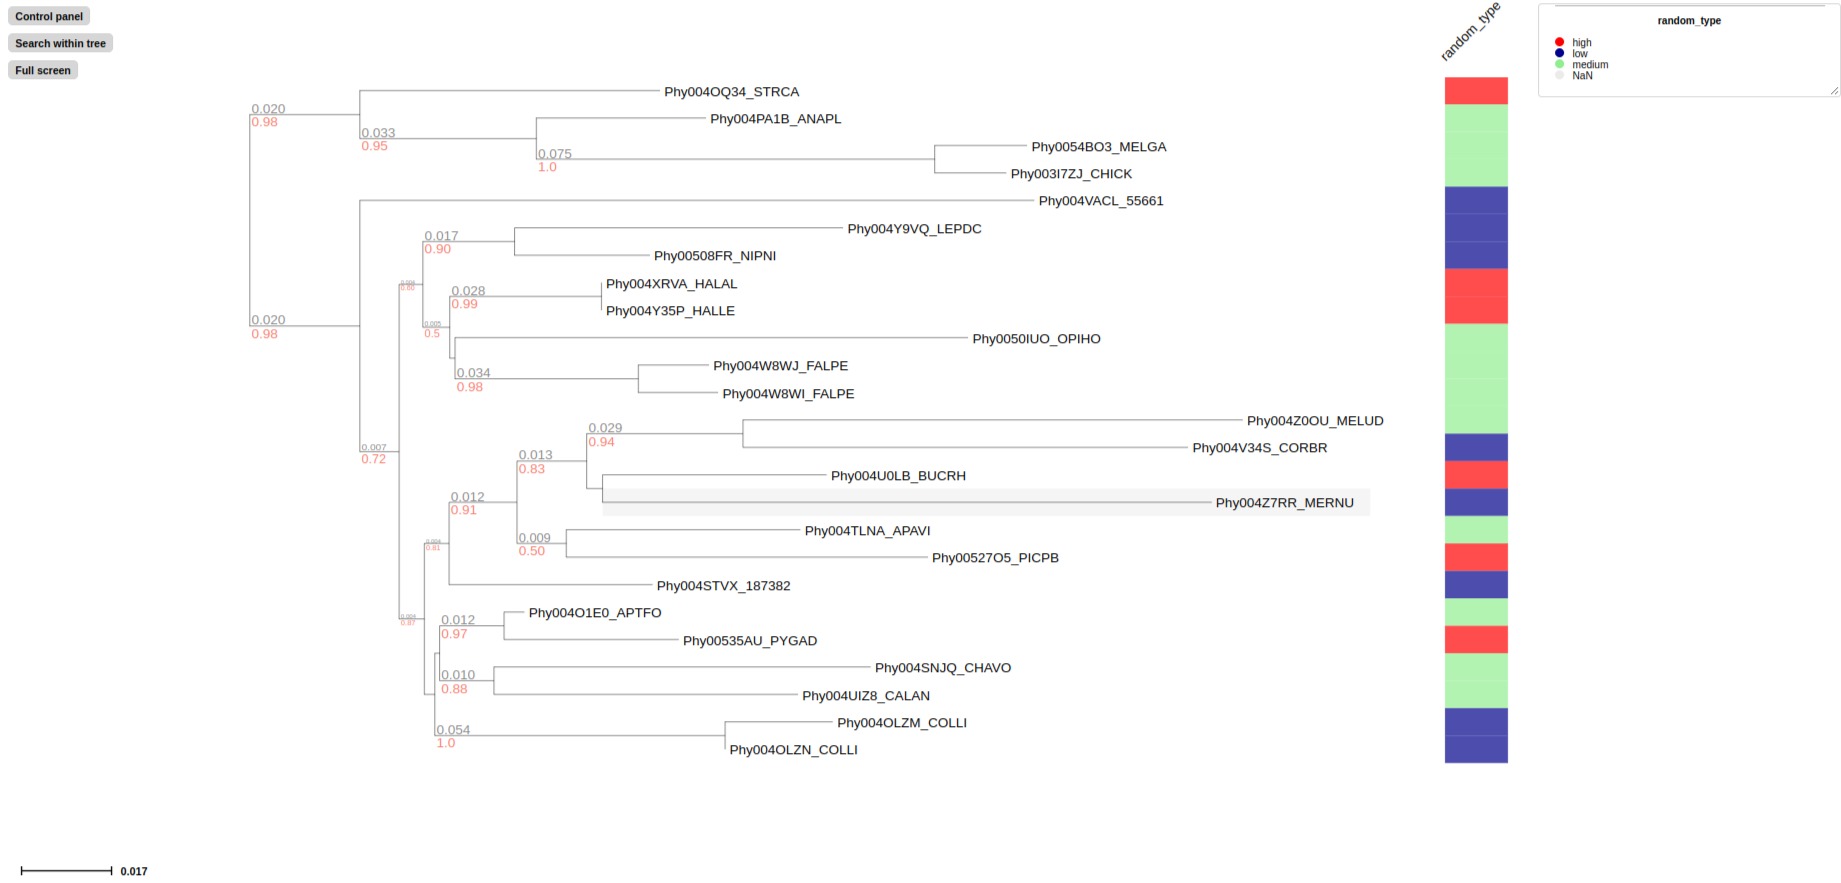
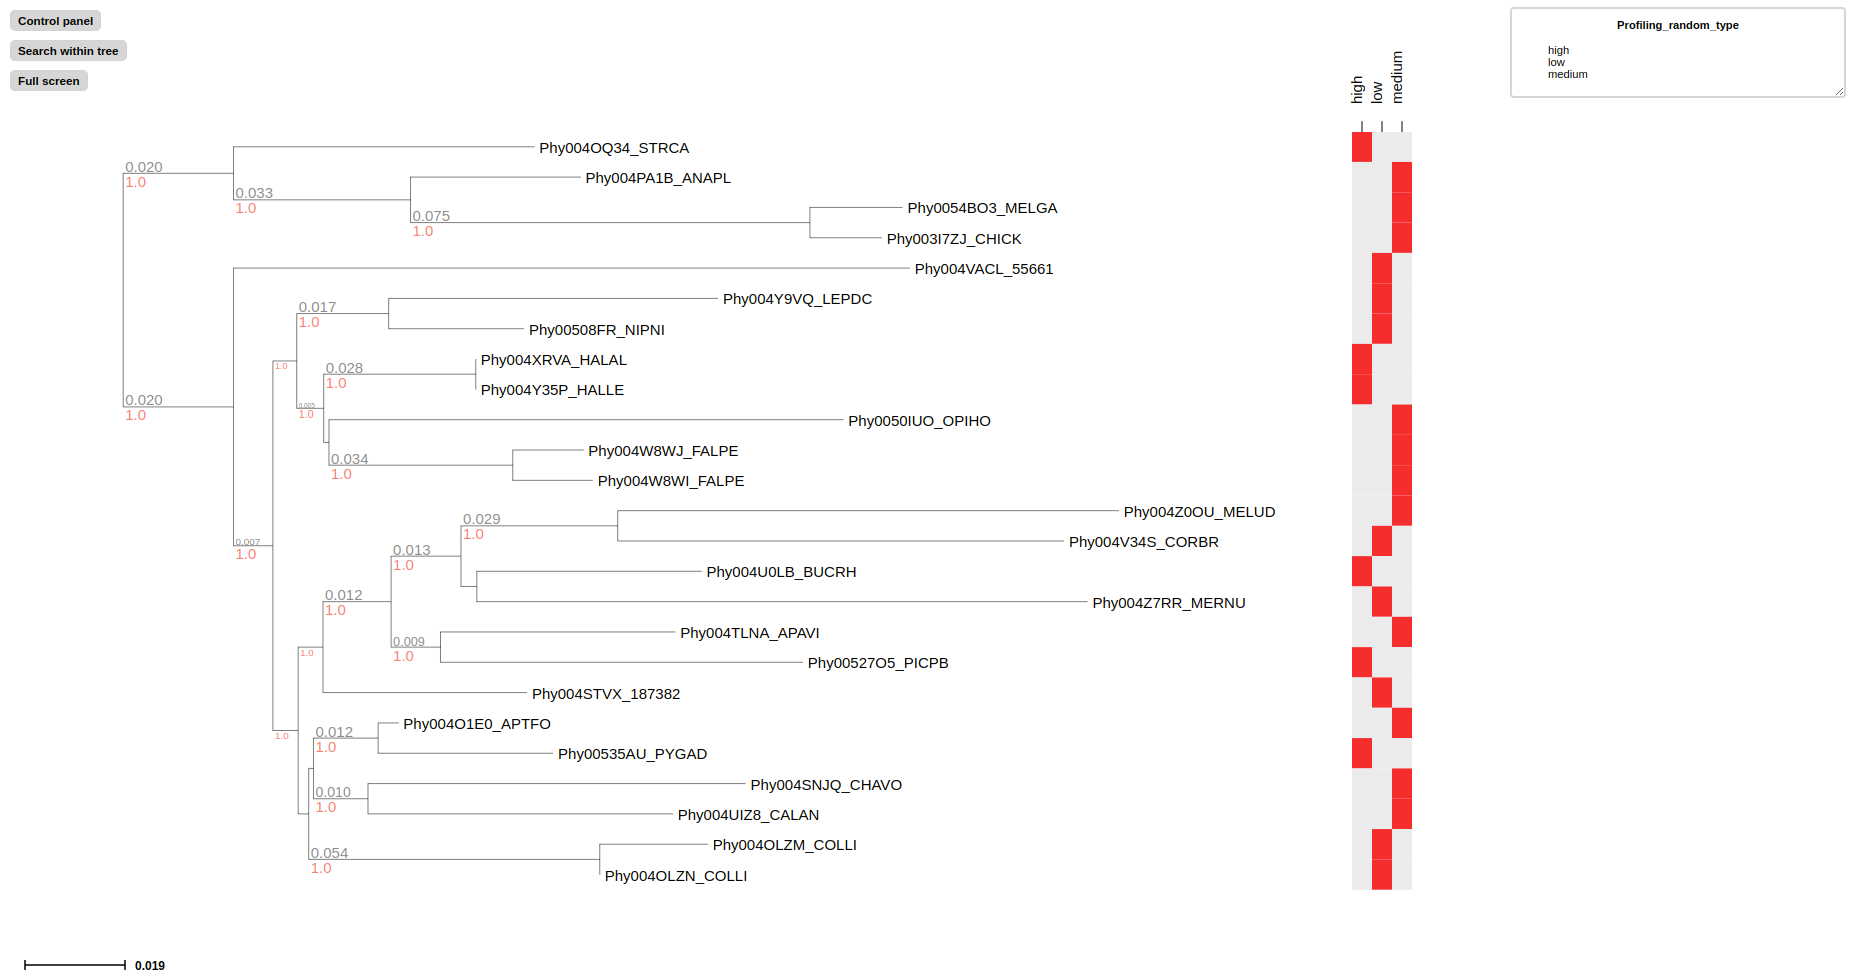
- Layouts for categorical data
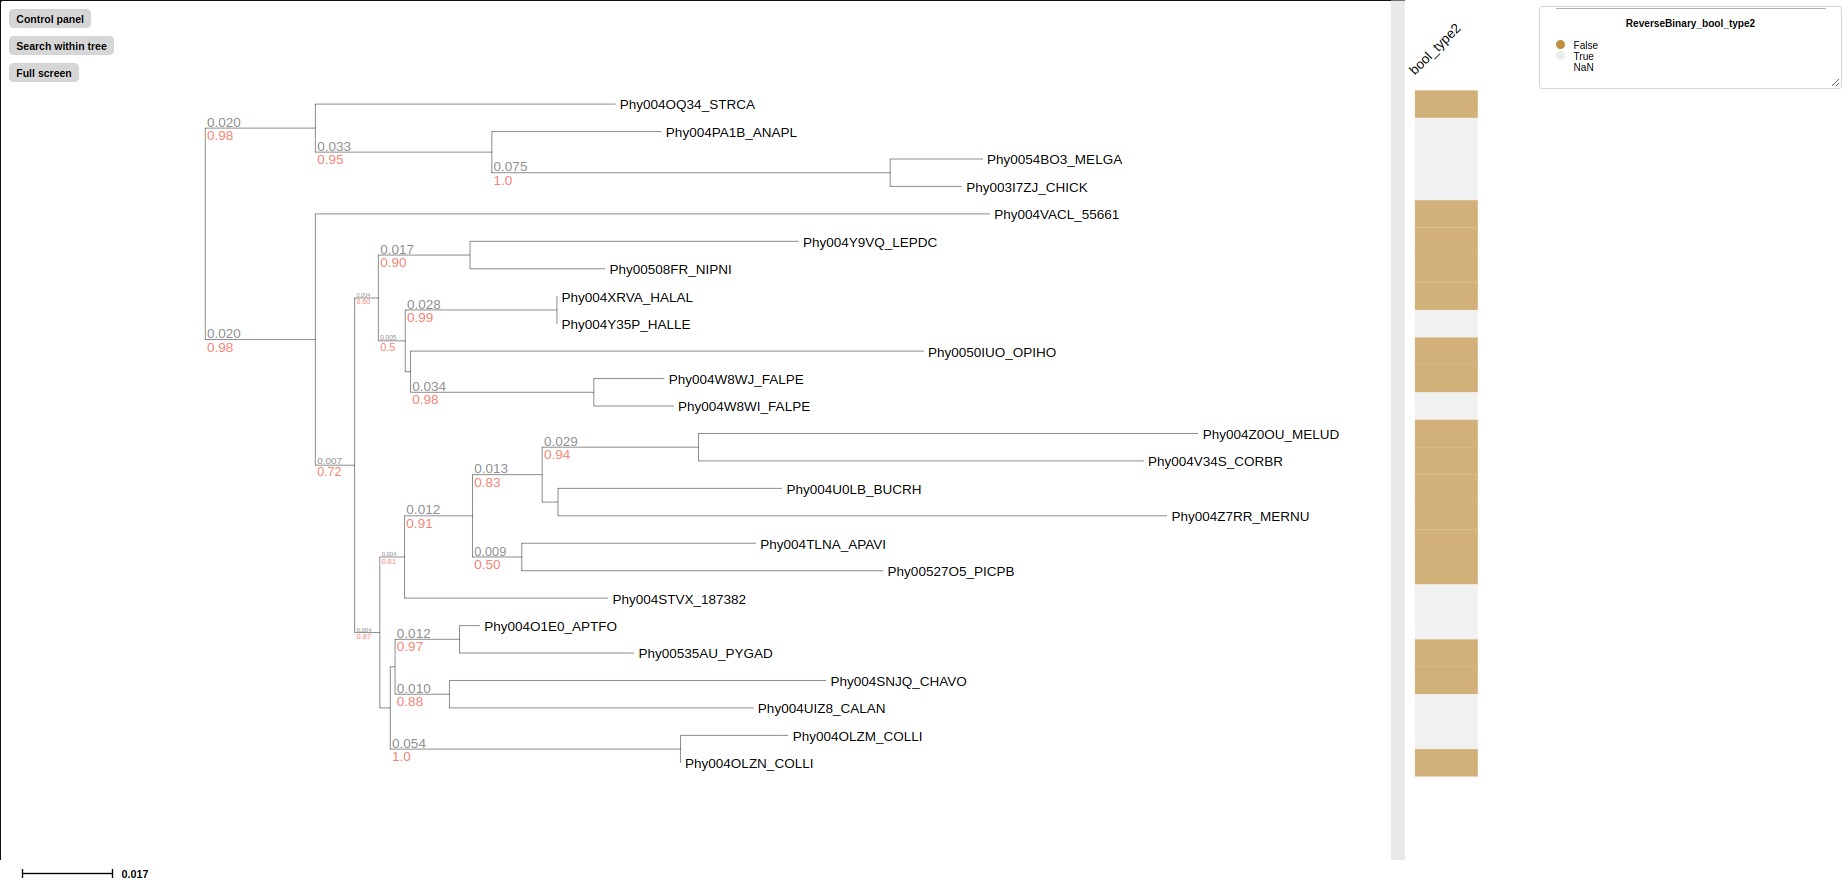
- Layouts for boolean data
- Layouts for numerical data
- Layouts for multiple text data
- Layouts for multiple sequence alignment
- Layouts for eggnog-mapper pfam annotations
- Layouts for eggnog-mapper smart annotations
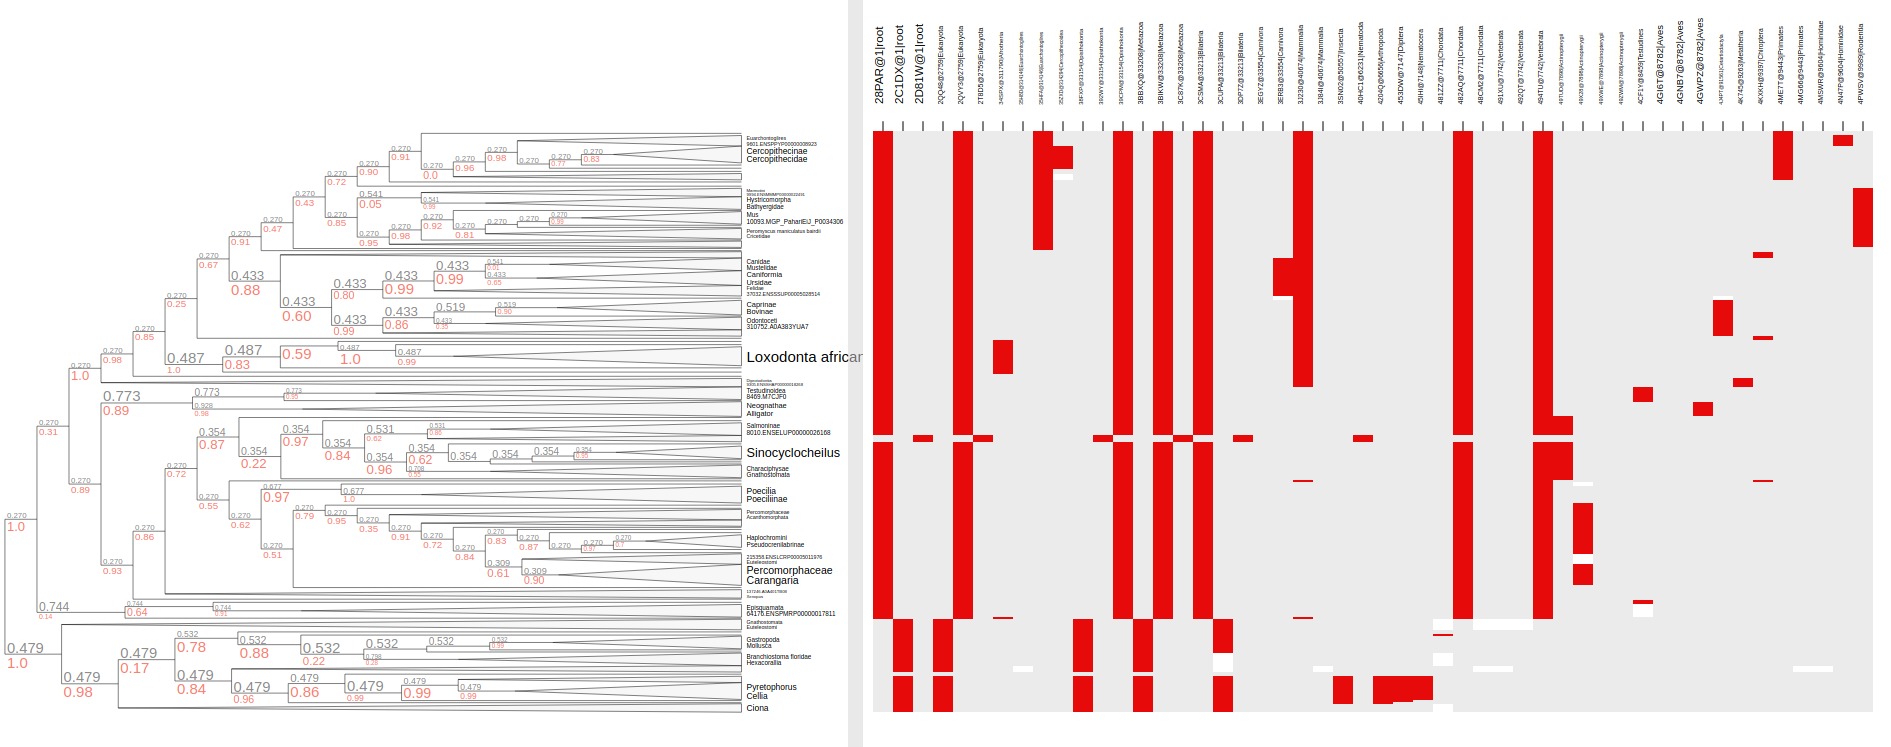
- Layouts for eggnog-mapper annotations
- Visualizing annotated internal nodes
- Layouts for Taxonomic data
- Conditional query in annotated tree
- Demo1 Explore progenome data
- Demo2 Explore eggnog-mapper annotations data with taxonomic annotation
- Demo3 Explore distribution of metallophores data in GTDB taxonomy
TreeProfiler is command-line tool for profiling metadata table into phylogenetic tree with descriptive analysis and output visualization
TreeProfiler requires to install ete4 toolkit
# install ete4 dependencies Cython
conda install -c anaconda cython
pip install Flask
pip install Flask-RESTful Flask-HTTPAuth Flask-Compress Flask-Cors
conda install six numpy scipy

# install ete4
git clone https://github.com/etetoolkit/ete.git
cd ete/
git branch checkout ete4
pip install -e .

# install BioPython
pip install biopython
Install TreeProfiler
# install selenium via pip
pip install selenium
# or conda
conda install -c conda-forge selenium

# install TreeProfiler
git clone https://github.com/dengzq1234/MetaTreeDrawer
cd MetaTreeDrawer/
# add treeprofiler to path
export PATH=$PATH:$(pwd)
TreeProfiler takes following file types as input
| Input | Filetype |
|---|---|
| Tree | Newick |
| Metadata | TSV |
TreeProfiler has two main subcommand:
- annotate
- plot
The first one annotate is used to annotate your input tree and corresponding metadata, TreeProfiler will map all the metadata into corresponding tree node. In this step, annotated tree will be generated in newick and ete format
treeprofiler.py annotate --tree tree.nw --metadata metadata.tsv --outdir ./
The second subcommand plot is used to visualize tree with associated metadata. By default, treeprofiler will launch an interactive session at localhost for user to explore input tree.
treeprofiler.py plot --tree tree_annotated.nw --tree_type newick
or
treeprofiler.py plot --tree tree_annotated.ete --tree_type ete
In this Tutorial we will use TreeProfiler and demostrate basic usage with data in examples/
tree examples/
examples/
├── basic_example1
│   ├── basic_example1_null.tsv
│   ├── basic_example1.nw
│   ├── basic_example1.tsv
│   └── unaligned_NUP62.fasta
├── basic_example2
│   ├── diauxic.array
│   ├── diauxic.nw
│   ├── FluA_H3_AA.fas
│   ├── MCC_FluA_H3_Genotype.txt
│   └── MCC_FluA_H3.nw
├── emapper
│   ├── 7955.ENSDARP00000116736.aln.faa
│   ├── 7955.ENSDARP00000116736.fasta
│   ├── 7955.ENSDARP00000116736.nw
│   ├── 7955.out.emapper.annotations
│   ├── 7955.out.emapper.annotations.clean
│   ├── 7955.out.emapper.pfam
│   └── 7955.out.emapper.smart.out
├── gtdb_example1
│   ├── gtdb_example1.nw
│   ├── gtdb_example1_taxa.nw
│   └── gtdb_example1.tsv
├── gtdb_example2
│   ├── bac120.tree
│   ├── gtdbv202.nw
│   └── taxonomy_and_metallophores.tsv
├── gtdb_metatree -> /home/deng/Projects/metatree_drawer/gtdb_metatree
├── progenome3
│   ├── progenome3.nw
│   └── progenome3.tsv
└── spongilla_example
    ├── spongilla_example.nw
    └── spongilla_example.tsv
usage: treeprofiler.py annotate [-h] [-t TREE] [--annotated_tree] [--tree_type TREE_TYPE]
                                [--prop2type PROP2TYPE] [--rank_limit RANK_LIMIT]
                                [--pruned_by PRUNED_BY] [-d METADATA] [--no_colnames]
                                [--text_prop TEXT_PROP] [--multiple_text_prop MULTIPLE_TEXT_PROP]
                                [--num_prop NUM_PROP] [--bool_prop BOOL_PROP]
                                [--text_prop_idx TEXT_PROP_IDX] [--num_prop_idx NUM_PROP_IDX]
                                [--bool_prop_idx BOOL_PROP_IDX] [--taxatree TAXATREE]
                                [--taxadb TAXADB] [--taxon_column TAXON_COLUMN]
                                [--taxon_delimiter TAXON_DELIMITER] [--taxa_field TAXA_FIELD]
                                [--emapper_annotations EMAPPER_ANNOTATIONS]
                                [--emapper_pfam EMAPPER_PFAM] [--emapper_smart EMAPPER_SMART]
                                [--alignment ALIGNMENT] [--taxonomic_profile]
                                [--num_stat NUM_STAT] [--counter_stat COUNTER_STAT] [--ete4out]
                                [-o OUTDIR] [--outtsv OUTTSV]

annotate tree

optional arguments:
  -h, --help            show this help message and exit

SOURCE TREE INPUT:
  Source tree input parameters

  -t TREE, --tree TREE  Input tree, .nw file, customized tree input
  --annotated_tree      input tree already annotated by treeprofiler
  --tree_type TREE_TYPE
                        statistic calculation to perform for numerical data in internal nodes,
                        [newick, ete]
  --prop2type PROP2TYPE
                        config tsv file where determine the datatype of target properties, if your
                        input tree type is .ete, it's note necessary

Pruning parameters:
  Auto pruning parameters

  --rank_limit RANK_LIMIT
                        TAXONOMIC_LEVEL prune annotate tree by rank limit
  --pruned_by PRUNED_BY
                        target tree pruned by customized conditions

METADATA TABLE parameters:
  Input parameters of METADATA

  -d METADATA, --metadata METADATA
                        <metadata.csv> .csv, .tsv. mandatory input
  --no_colnames         metadata table doesn't contain columns name
  --text_prop TEXT_PROP
                        <col1,col2> names, column index or index range of columns which need to be
                        read as categorical data
  --multiple_text_prop MULTIPLE_TEXT_PROP
                        <col1,col2> names, column index or index range of columns which need to be
                        read as categorical data which contains more than one value and seperate
                        by ',' such as GO:0000003,GO:0000902,GO:0000904,GO:0003006
  --num_prop NUM_PROP   <col1,col2> names, column index or index range of columns which need to be
                        read as numerical data
  --bool_prop BOOL_PROP
                        <col1,col2> names, column index or index range of columns which need to be
                        read as boolean data
  --text_prop_idx TEXT_PROP_IDX
                        1,2,3 or [1-5] index of columns which need to be read as categorical data
  --num_prop_idx NUM_PROP_IDX
                        1,2,3 or [1-5] index columns which need to be read as numerical data
  --bool_prop_idx BOOL_PROP_IDX
                        1,2,3 or [1-5] index columns which need to be read as boolean data
  --taxatree TAXATREE   <kingdom|phylum|class|order|family|genus|species|subspecies> reference
                        tree from taxonomic database
  --taxadb TAXADB       <NCBI|GTDB> for taxonomic profiling or fetch taxatree default [GTDB]
  --taxon_column TAXON_COLUMN
                        <col1> name of columns which need to be read as taxon data
  --taxon_delimiter TAXON_DELIMITER
                        delimiter of taxa columns. default [;]
  --taxa_field TAXA_FIELD
                        field of taxa name after delimiter. default 0
  --emapper_annotations EMAPPER_ANNOTATIONS
                        out.emapper.annotations
  --emapper_pfam EMAPPER_PFAM
                        out.emapper.pfams
  --emapper_smart EMAPPER_SMART
                        out.emapper.smart
  --alignment ALIGNMENT
                        Sequence alignment, .fasta format

Annotation arguments:
  Annotation parameters

  --taxonomic_profile   Determine if you need taxonomic annotation on tree
  --num_stat NUM_STAT   statistic calculation to perform for numerical data in internal nodes,
                        [all, sum, avg, max, min, std]
  --counter_stat COUNTER_STAT
                        statistic calculation to perform for categorical data in internal nodes,
                        raw count or in percentage [raw, relative]

OUTPUT options:

  --ete4out             export intermediate tree in ete4
  -o OUTDIR, --outdir OUTDIR
                        output annotated tree
  --outtsv OUTTSV       output annotated tsv file
At the above example, we only mapped metadata to leaf nodes, in this example, we will also profile internal nodes annotation and analysis of their children nodes.
TreeProfiler can infer automatically the datatype of each column in your metadata, including
list(seperate by,)string(categorcial data)numerical(numerical data, float or integer)booleans
Internal node will summurize children nodes information according to their datatypes.
demo tree
      ╭╴A
╴root╶┤
      │   ╭╴B
      ╰╴D╶┤
          ╰╴C
demo metadata
| #name | text_property | multiple_text_property | numerical_property | bool_property |
|---|---|---|---|---|
| A | vowel | a,b,c | 10 | True |
| B | consonant | b,c,d | 4 | False |
| C | consonant | c,d,e | 9 | True |
Treeprofiler will infer the datatypes of above metadata and adpot different summary method:
| - | text_property | multiple_text_property | numerical_property | bool_property |
|---|---|---|---|---|
| datatype | string | list | float | bool |
| method | counter | counter | average,sum,max,min,standard deviation | counter |
After annotation, internal nodes will be summarized. If property was summarize with counter, in internal node will be named as <property_name>_counter
Users can choose either counter is raw or relative count by using --counter_stat
| internal_node properties | statistic method |
|---|---|
<feature name>_counter |
raw(default), relative |
| internal_node | text_property_counter | multiple_text_property_counter | bool_property_counter |
|---|---|---|---|
| D | consonant--2 | b--1||c--2||d--2||e--1 | True--1||False--1 |
| root | vowel--1||consonant--2 | a--2||b--2||c--3||d--2||e--1 | True--2||False--1 |
After annotation, internal nodes will be summarized. If property was numerical data, in internal node will be named as
| internal_node properties | statistic method |
|---|---|
<feature name>_avg |
average |
<feature name>_sum |
sum |
<feature name>_max |
maximum |
<feature name>_min |
minimum |
<feature name>_std |
standard deviation |
By default, numerical feature will be calculated all the descriptive statistic, but users can choose specific one to be calculated by using --num_stat [all, sum, avg, max, min, std]
In our demo, it would be:
| internal_node | numerical_property_avg | numerical_property_sum | numerical_property_max | numerical_property_max | numerical_property_max |
|---|---|---|---|---|---|
| D | 6.5 | 13 | 9 | 4 | 2.5 |
| root | 7.67 | 23 | 10 | 4 | 2.32 |
Excecute example data provided in examples/
treeprofiler.py annotate \
    --tree examples/basic_example1/basic_example1.nw \
    --metadata examples/basic_example1/basic_example1.tsv \
--outdir ./examples/basic_example1/Although TreeProfiler can detect datatype of each column, users still can determine the datatype using the following arguments using
-
--text_propand--text_prop_idx, to determine columms which need to be read as categorical data -
--multiple_text_prop, to determine columns which contains multiple values sperated by,, and will be process as list -
--num_propand--num_prop_idx, to determine columms which need to be read as numerical data -
--bool_propand--bool_prop_idx, to determine columms which need to be read as boolean data
if metadata doesn't contain column names, please add --no_colnames as flag. TreeProfiler will automatically assign feature name by index order
If input metadada containcs taxon data, TreeProfiler allows users to process taxonomic annotation with either GTDB or NCBI database.
--taxadb,NCBIorGTDB, choose the Taxonomic Database for annotation--taxon_column, choose the column in metadata which representa taxon--taxonomic_profile, activate taxonomic annotation--taxon_delimiter, delimiter of taxa columns. default.--taxa_field, field of taxa name after delimiter. default0
Here we demonstrate with examples/gtdb_example1/gtdb_example1.nw and examples/gtdb_example1/gtdb_example1.tsv. Taxonomic accesion IDs are located in the first column which should be the names of leaf. If accesions are located in different columns, using --taxon_column <column name> to locate the the column.
# in case of gtdb_example1.tsv
head -3 examples/gtdb_example1/gtdb_example1.tsv
name	sample1	sample2	sample3	sample4	sample5	random_type	bool_type	bool_type2
RS_GCF_001560035.1	0.05	0.12	0.86	0.01	0.69	medium	1	True
RS_GCF_001560635.1	0.64	0.67	0.51	0.29	0.14	medium	1	True

# annotate tree with gtdb taxonomic annotation
treeprofiler.py annotate --tree examples/gtdb_example1/gtdb_example1.nw --metadata examples/gtdb_example1/gtdb_example1.tsv --taxonomic_profile --taxadb GTDB --outdir ./examples/gtdb_example1/
For instance of examples/spongilla_example/spongilla_example.nw and examples/spongilla_example/spongilla_example.tsv, it contains accession ID such as 83887.comp22273_c0_seq2_m.43352, hence using --taxon_delimiter and --taxa_field to locate the taxonomic accession.
treeprofiler.py annotate --tree examples/spongilla_example/spongilla_example.nw --metadata examples/spongilla_example/spongilla_example.tsv --taxonomic_profile --taxon_column name --taxon_delimiter . --taxa_field 0 --taxadb NCBI --outdir ./examples/spongilla_example/
treeprofiler annotate subcommand will generate the following output file
<input_tree>+ _annotated.nw, newick format with annotated tree<input_tree>+ _annotated.ete, ete format with annotated tree<input_tree>+ _annotated_prop2type.txt, config file where store the datatype of each annotated properties
In the following plot step, users can use either .nw or .ete by putting --tree_type [newick, ete] flag to identify. The difference between .nw and .ete format is
-
newick file is more universal and be able to used in different other phylogenetic software although associated data of tree nodes will be considered as plain text, so if you use newick format, alongside with the prop2type config file which was generated before by adding
--prop2type <prop2type_file> -
ete format is a novel format developed to solve the situation we encounter in the previous step, annotated tree can be recover easily with all the annotated data without changing the data type. Besides, the ete format optimized the tree file size after mapped with its associated data. Hence it's very handy for programers in their own script. At this moment we can only view the ete format in treeprofiler, but we will make the ete format more universal to other phylogenetic software.
TreeProfiler provides a several of layout options for visualize features in metadata along with tree, depends on their datatype
treeprofiler.py plot -h
usage: treeprofiler.py plot [-h] [-t TREE] [--annotated_tree]
                            [--tree_type TREE_TYPE]
                            [--prop2type PROP2TYPE]
                            [--rank_limit RANK_LIMIT]
                            [--pruned_by PRUNED_BY]
                            [--internal_plot_measure INTERNAL_PLOT_MEASURE]
                            [--collapsed_by COLLAPSED_BY]
                            [--highlighted_by HIGHLIGHTED_BY]
                            [--drawer DRAWER]
                            [--collapse_level COLLAPSE_LEVEL]
                            [--ultrametric] [--column_width COLUMN_WIDTH]
                            [--barplot_width BARPLOT_WIDTH]
                            [--profiling_width PROFILING_WIDTH]
                            [--binary_layout BINARY_LAYOUT]
                            [--revbinary_layout REVBINARY_LAYOUT]
                            [--colorbranch_layout COLORBRANCH_LAYOUT]
                            [--label_layout LABEL_LAYOUT]
                            [--rectangular_layout RECTANGULAR_LAYOUT]
                            [--heatmap_layout HEATMAP_LAYOUT]
                            [--barplot_layout BARPLOT_LAYOUT]
                            [--taxonclade_layout]
                            [--taxonrectangular_layout] [--emapper_layout]
                            [--domain_layout] [--alignment_layout]
                            [--profiling_layout PROFILING_LAYOUT]
                            [--multi_profiling_layout MULTI_PROFILING_LAYOUT]
                            [--numerical_profiling_layout NUMERICAL_PROFILING_LAYOUT]
                            [--port PORT] [--plot PLOT] [--out_colordict]

annotate plot

optional arguments:
  -h, --help            show this help message and exit

SOURCE TREE INPUT:
  Source tree input parameters

  -t TREE, --tree TREE  Input tree, .nw file, customized tree input
  --annotated_tree      input tree already annotated by treeprofiler
  --tree_type TREE_TYPE
                        statistic calculation to perform for numerical
                        data in internal nodes, [newick, ete]
  --prop2type PROP2TYPE
                        config tsv file where determine the datatype of
                        target properties, if your input tree type is
                        .ete, it's note necessary

Pruning parameters:
  Auto pruning parameters

  --rank_limit RANK_LIMIT
                        TAXONOMIC_LEVEL prune annotate tree by rank limit
  --pruned_by PRUNED_BY
                        target tree pruned by customized conditions

Conditional display arguments:
  Conditional display parameters

  --internal_plot_measure INTERNAL_PLOT_MEASURE
                        statistic measures to be shown in numerical layout
                        for internal nodes, [default: avg]
  --collapsed_by COLLAPSED_BY
                        target tree collapsed by customized conditions
  --highlighted_by HIGHLIGHTED_BY
                        target tree highlighted by customized conditions

Properties' layout arguments:
  Prop layout parameters

  --column_width COLUMN_WIDTH
                        customize column width of each layout.
  --barplot_width BARPLOT_WIDTH
                        customize barplot width of barplot layout.
  --profiling_width PROFILING_WIDTH
                        customize profiling width of each profiling
                        layout.
  --binary_layout BINARY_LAYOUT
                        <col1,col2> names, column index or index range of
                        columns which need to be plot as binary_layout
  --revbinary_layout REVBINARY_LAYOUT
                        <col1,col2> names, column index or index range of
                        columns which need to be plot as revbinary_layout
  --colorbranch_layout COLORBRANCH_LAYOUT
                        <col1,col2> names, column index or index range of
                        columns which need to be plot as Textlayouts
  --label_layout LABEL_LAYOUT
                        <col1,col2> names, column index or index range of
                        columns which need to be plot as label_layout
  --rectangular_layout RECTANGULAR_LAYOUT
                        <col1,col2> names, column index or index range of
                        columns which need to be plot as
                        rectangular_layout
  --heatmap_layout HEATMAP_LAYOUT
                        <col1,col2> names, column index or index range of
                        columns which need to be read as heatmap_layout
  --barplot_layout BARPLOT_LAYOUT
                        <col1,col2> names, column index or index range of
                        columns which need to be read as barplot_layouts
  --taxonclade_layout   activate taxonclade_layout
  --taxonrectangular_layout
                        activate taxonrectangular_layout
  --emapper_layout      activate emapper_layout
  --domain_layout       activate domain_layout
  --alignment_layout    provide alignment file as fasta format
  --profiling_layout PROFILING_LAYOUT
                        <col1,col2> names, column index which need to be
                        plot as profiling_layout for categorical columns
  --multi_profiling_layout MULTI_PROFILING_LAYOUT
                        <col1,col2> names, column index which need to be
                        plot as multi_profiling_layout for multiple values
                        column
  --numerical_profiling_layout NUMERICAL_PROFILING_LAYOUT
                        <col1,col2> names, column index which need to be
                        plot as numerical_profiling_layout for numerical
                        values column

Output arguments:
  Output parameters
  --port PORT           run interactive session on custom port
  --plot PLOT           output as pdf
  --out_colordict       print color dictionary of each property
Here we use examples/basic_example1/ and examples/basic_example2/
tree examples/basic_example1/
examples/basic_example1/
├── basic_example1_null.tsv
├── basic_example1.nw
├── basic_example1.tsv
└── unaligned_NUP62.fasta

tree examples/basic_example2
examples/basic_example2
├── diauxic.array
├── diauxic.nw
├── FluA_H3_AA.fas
├── MCC_FluA_H3_Genotype.txt
└── MCC_FluA_H3.nw


head examples/basic_example1/basic_example1.tsv
#name	sample1	sample2	sample3	sample4	sample5	random_type	*bool_type	bool_type2
Phy003I7ZJ_CHICK	0.05	0.12	0.86	0.01	0.69	medium	1	TRUE
Phy0054BO3_MELGA	0.64	0.67	0.51	0.29	0.14	medium	1	TRUE
Phy00508FR_NIPNI	0.89	0.38	0.97	0.49	0.26	low	1	FALSE
Phy004O1E0_APTFO	0.1	0.09	0.38	0.31	0.41	medium	0	TRUE

head -3 examples/basic_example2/diauxic.array
#NAMES	col1	col2	col3	col4	col5	col6	col7
YGR138C	-1.23	-0.81	1.79	0.78	-0.42	-0.69	0.58
YPR156C	-1.76	-0.94	1.16	0.36	0.41	-0.35	1.12

head -3 examples/basic_example2/MCC_FluA_H3_Genotype.txt
#name	PB2	PB1	PA	HA	NP	NA	M	NS
A/Swine/Binh_Duong/03_10/2010	trig	trig	trig	HuH3N2	trig	HuH3N2	trig	trig
A/Swine/Binh_Duong/03_08/2010	trig	trig	trig	HuH3N2	trig	HuH3N2	trig	trig

## annotate tree
treeprofiler.py annotate --tree examples/basic_example1/basic_example1.nw --metadata examples/basic_example1/basic_example1.tsv --bool_prop bool_type -o examples/basic_example1/

treeprofiler.py annotate --tree examples/basic_example2/diauxic.nw --metadata examples/basic_example2/diauxic.array --outdir examples/basic_example2/

treeprofiler.py annotate --tree examples/basic_example2/MCC_FluA_H3.nw --metadata examples/basic_example2/MCC_FluA_H3_Genotype.txt --outdir examples/basic_example2/
*if bool value is 1 or 0, treeprofiler will infer it as numerical data, hence we determine it as boolean value by using --bool_prop arguments
Users can add the following flag to activate layouts for categorical data
--colorbranch_layout COLORBRANCHLAYOUT
                            <col1,col2> names, column index or index range of columns which need to be plot as Textlayouts
--label_layout LABELLAYOUT
                        <col1,col2> names, column index or index range of columns which need to be plot as label_layout
--rectangular_layout RECTANGULARLAYOUT
                        <col1,col2> names, column index or index range of columns which need to be plot as rectangular_layout
--profiling_layout PROFILING_LAYOUT
                        <col1,col2> names, column index which need to be plot as
                        profiling_layout for categorical columns
example
## target column "random_type" in examples/basic_example1/basic_example1.tsv
# List random_type feature as text in aligned panel using label_layout
treeprofiler.py plot --tree examples/basic_example1/basic_example1_annotated.nw --label_layout random_type

# Label random_type feature on branch with different colors in aligned panel  using --colorbranch_layout
treeprofiler.py plot --tree examples/basic_example1/basic_example1_annotated.nw  --colorbranch_layout random_type

# Label random_type feature with retangular block in aligned panel using --rectangular_layout
treeprofiler.py plot --tree examples/basic_example1/basic_example1_annotated.nw  --rectangular_layout random_type

# Label all feature with retangular block in aligned panel using --profiling_layout
treeprofiler.py plot --tree examples/basic_example2/MCC_FluA_H3_annotated.nw --profiling_layout PB2,PB1,PA,HA,NP,NA,M,NS
Users can add the following flag to activate layouts for Boolean data
--binary_layout BINARYLAYOUT
                        <col1,col2> names, column index or index range of columns which need to be plot as binary_layout, label shown only positive value
--revbinary_layout REVBINARYLAYOUT
                        <col1,col2> names, column index or index range of columns which need to be plot as revbinary_layout, label shown only negative value
--profiling_layout PROFILING_LAYOUT
                        <col1,col2> names, column index which need to be plot as
                        profiling_layout for categorical columns
## target column "bool_type", "bool_type2" in examples/basic_example1/basic_example1.tsv
# List postive bool_type feature in aligned panel using binary_layout
treeprofiler.py plot --tree examples/basic_example1/basic_example1_annotated.nw  --binary_layout bool_type

# List negative bool_type feature in aligned panel using binary_layout
treeprofiler.py plot --tree examples/basic_example1/basic_example1_annotated.nw  --revbinary_layout bool_type2

# multiple columns seperated by ','
treeprofiler.py plot --tree examples/basic_example1/basic_example1_annotated.nw  --profiling_layout bool_type,bool_type2
Users can add the following flag to activate layouts for Numerical data
--heatmap_layout HEATMAPLAYOUT
                        <col1,col2> names, column index or index range of columns which need to be read as heatmap_layout
--barplot_layout BARPLOTLAYOUT
                        <col1,col2> names, column index or index range of columns which need to be read as barplot_layouts
--numerical_profiling_layout NUMERICAL_PROFILING_LAYOUT
                        <col1,col2> names, column index which need to be plot as
                        numerical_profiling_layout for numerical values column
## target column 'sample[1-5]' feature in examples/basic_example1/basic_example1.tsv
# visualize sample1 feature in Barplot
treeprofiler.py plot --tree examples/basic_example1/basic_example1_annotated.nw  --barplot_layout sample1,sample2,sample3,sample4,sample5

# visualize sample1-sample5 in Heatmap
treeprofiler.py plot --tree examples/basic_example1/basic_example1_annotated.nw --heatmap_layout sample1,sample2,sample3,sample4,sample5

# visualize sample1-sample5 in numerical profiling
#treeprofiler.py plot --tree examples/basic_example1/basic_example1_annotated.nw --numerical_profiling_layout sample1,sample2,sample3,sample4,sample5

treeprofiler.py plot --tree examples/basic_example2/diauxic_annotated.nw --numerical_profiling_layout col1,col2,col3,col4,col5,col6,col7
here we use example in examples/emapper/
tree examples/emapper/examples/emapper/
├── 7955.ENSDARP00000116736.aln.faa
├── 7955.ENSDARP00000116736.fasta
├── 7955.ENSDARP00000116736.nw
├── 7955.out.emapper.annotations
├── 7955.out.emapper.annotations.clean
├── 7955.out.emapper.pfam
└── 7955.out.emapper.smart.out

head examples/emapper/7955.out.emapper.annotations.clean
#query	seed_ortholog	evalue	score	eggNOG_OGs	max_annot_lvl	COG_category	Description	Preferred_name	GOs	EC	KEGG_ko	KEGG_Pathway	KEGG_Module	KEGG_Reaction	KEGG_rclass	BRITE	KEGG_TC	CAZy	BiGG_Reaction	PFAMs
10020.ENSDORP00000023664	43179.ENSSTOP00000019678	7.24e-191	538.0	28PAR@1|root,2QVY3@2759|Eukaryota,..	TP53	GO:0000002,GO:0000003,GO:0000060,..	-	ko:K04451,..	-	-	-	ko00000,ko00001,ko03000,ko03036,ko03400	-	-	-	P53,P53_tetramer

## annotate tree first
treeprofiler.py annotate --tree examples/emapper/7955.ENSDARP00000116736.nw --metadata examples/emapper/7955.out.emapper.annotations.clean -o examples/emapper/
As you can see, many columns in metadata are mulitiple value which seperated by ,, such as eggNOG_OGs, GOs, KEGG_ko, KEGG_Pathway, etc. Users can visualize those information using --multi_profiling_layout. In this case, we highly reccomend users using ete as tree_type
# visualize using multi_profiling_layout
treeprofiler.py plot --tree examples/emapper/7955.ENSDARP00000116736_annotated.ete --tree_type ete --multi_profiling_layout eggNOG_OGs
In order to visualize multiple sequence alignment alongside with the tree, first we need to annotate alignment using --alignment in annotate. Then activate alignment layout by adding --alignment_layout
# annotate
treeprofiler.py annotate --tree examples/basic_example2/MCC_FluA_H3.nw --alignment  ./examples/basic_example2/FluA_H3_AA.fas --outdir examples/basic_example2/

# visualize
treeprofiler.py plot --tree examples/basic_example2/MCC_FluA_H3_annotated.nw --alignment_layout
if metadata is pfam annotations from eggnog-mapper, using --emapper_pfam to annotate domain information in target tree and must be with the alignment using --alignment to attach corresponding file.
Once tree is annotated, using --domain_layout to visualize it.
treeprofiler.py annotate --tree examples/emapper/7955.ENSDARP00000116736.nw --emapper_pfam examples/emapper/7955.out.emapper.pfam --alignment examples/emapper/7955.ENSDARP00000116736.aln.faa -o examples/emapper/

treeprofiler.py plot --tree examples/emapper/7955.ENSDARP00000116736_annotated.nw --domain_layout
if metadata is smart annotations from eggnog-mapper, using --emapper_smart to annotate domain information in target tree and must be with the alignment using --alignment to attach corresponding file.
Once tree is annotated, using --domain_layout to visualize it.
treeprofiler.py annotate --tree examples/emapper/7955.ENSDARP00000116736.nw --emapper_smart examples/emapper/7955.out.emapper.smart.out --alignment examples/emapper/7955.ENSDARP00000116736.aln.faa -o examples/emapper/

treeprofiler.py plot --tree examples/emapper/7955.ENSDARP00000116736_annotated.nw --domain_layout
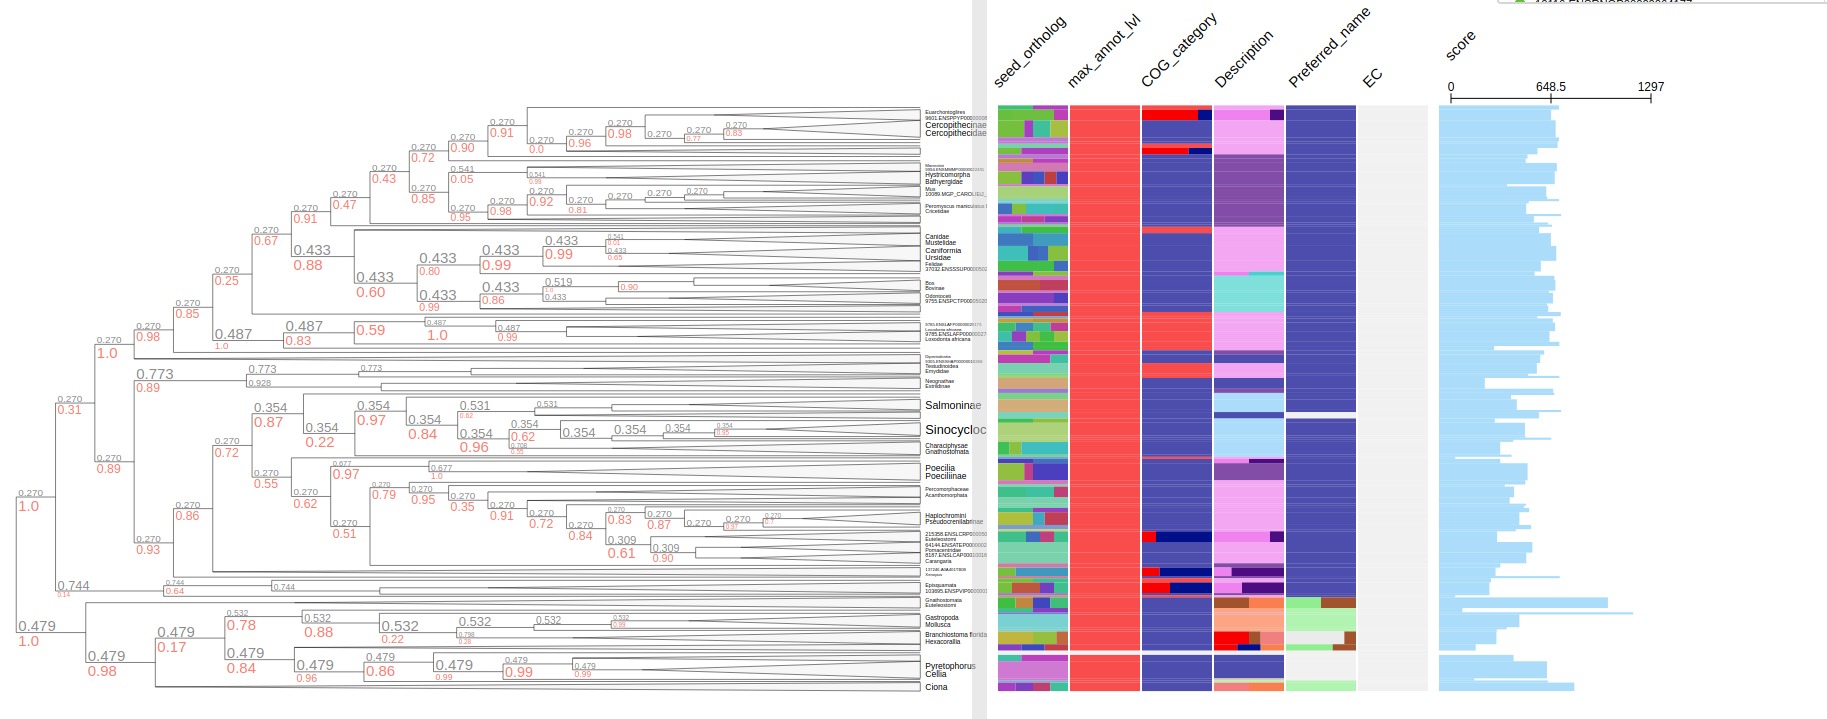
If metadata is output from eggnog-mapper, using --emapper_annotations automatically parse all information as metadata. Program will parse data of all the columns from emapper output. Once tree is annotated, using --emapper_layout to visualize tree with all the metadata
seed_ortholog evalue score eggNOG_OGs max_annot_lvl COG_category Description Preferred_name GOs EC KEGG_ko KEGG_Pathway KEGG_Module KEGG_Reaction KEGG_rclass BRITE KEGG_TC CAZy BiGG_Reaction PFAMs
treeprofiler.py annotate --tree examples/emapper/7955.ENSDARP00000116736.nw --emapper_annotations examples/emapper/7955.out.emapper.annotations -o examples/emapper/

treeprofiler.py plot --tree examples/emapper/7955.ENSDARP00000116736_annotated.ete --tree_type ete --emapper_layout
If internal nodes are annotated, TreeProfiler is also able to visualize annotated features automatically when layouts are activated
As internal nodes of categorical and boolean data are annotated as counter, for categorical data it generates a stacked bar of counter summary at the top of each internal node. And for boolean data, it generates a heatmap where represent positive(or negative) percentage of total data of each internal node.
Internal nodes of numerical data are process descriptive statistic analysis by default, hence when users collapse any branch, barplot_layout or heatmap_layout will demonstrate representative value, avg by default. representative value can be changed by using --internal_plot_measure
example
# select max instead of avg as internal node ploting representative
treeprofiler.py plot --tree examples/basic_example1/basic_example1_annotated.nw  --heatmap_layout sample1,sample2,sample3,sample4,sample5 --internal_plot_measure max
After collapsed
avg as itnernal plot measure
 max as itnernal plot measure

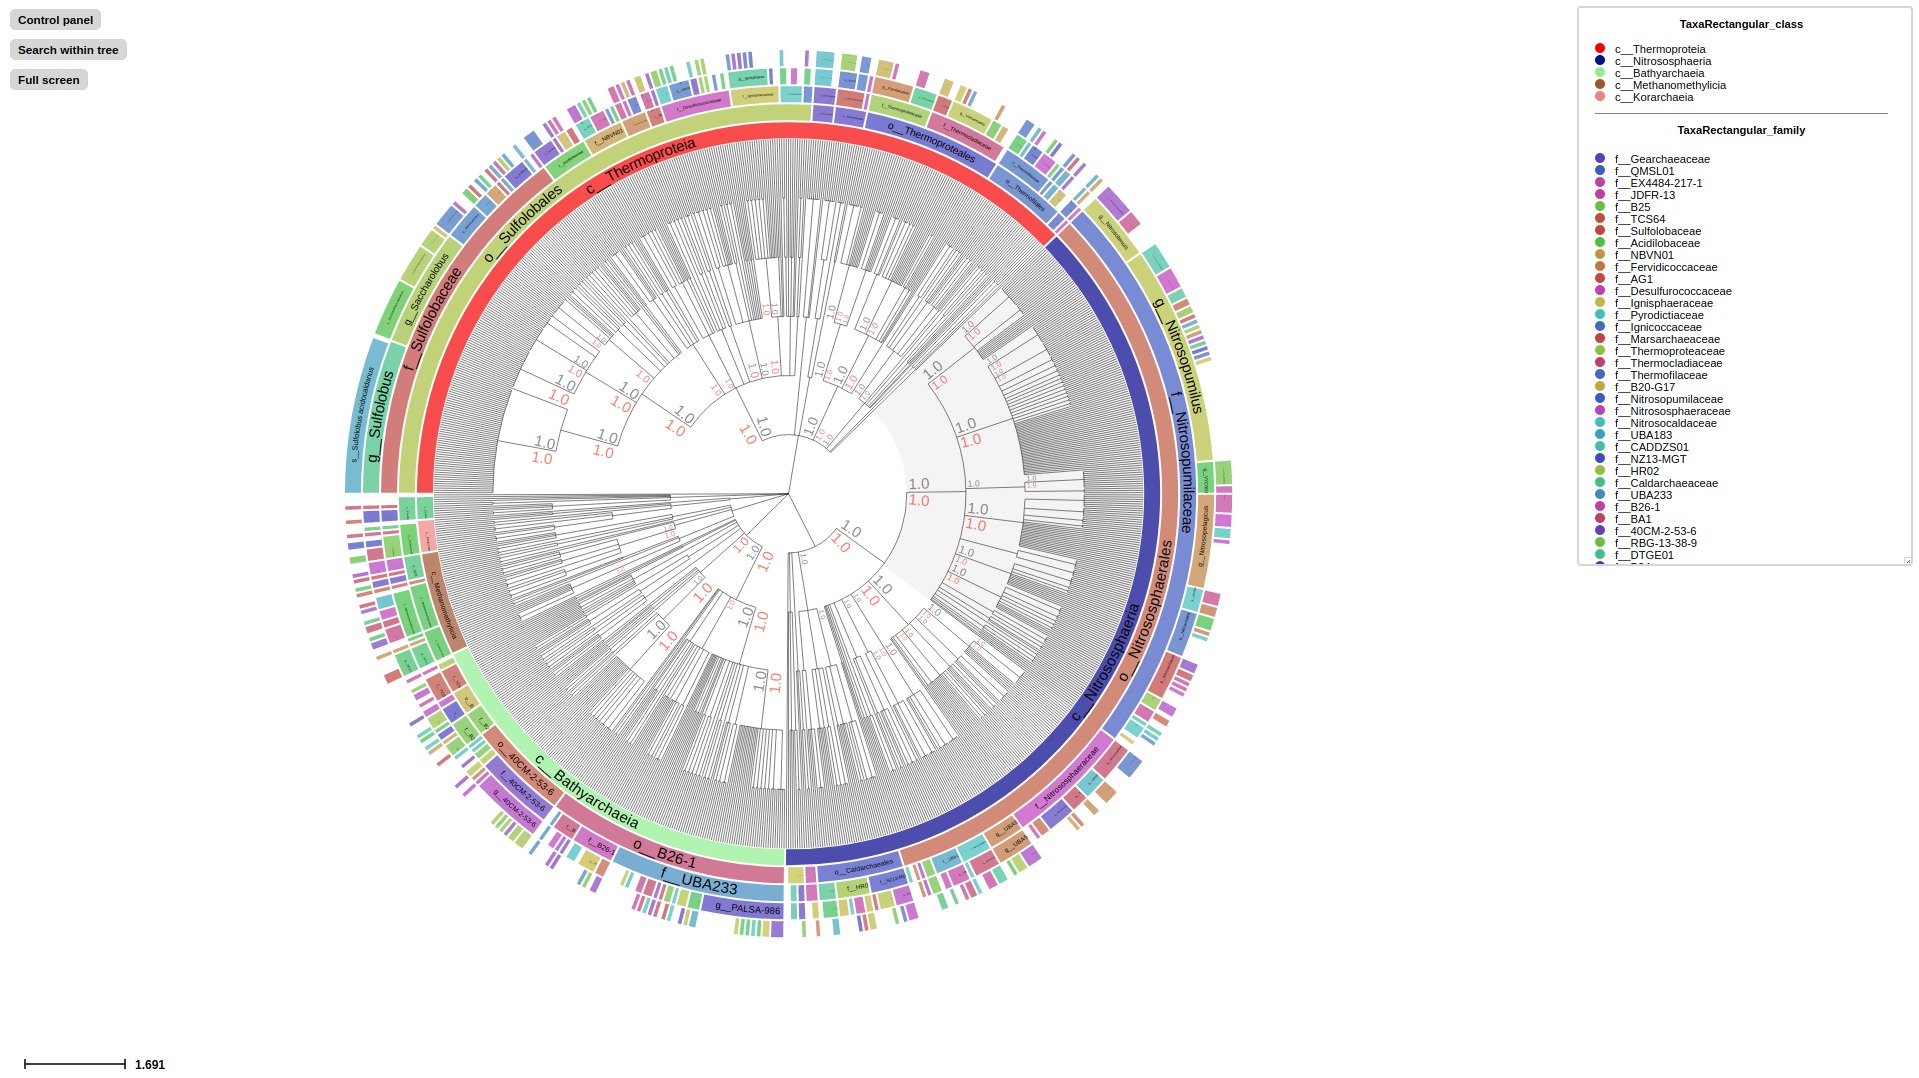
Activate Taxonomic layout using --taxonclade_layout or --taxonrectangular_layout
## Annotate
# GTDB
treeprofiler.py annotate --tree examples/gtdb_example1/gtdb_example1.nw --metadata examples/gtdb_example1/gtdb_example1.tsv --taxon_column name --taxonomic_profile --taxadb GTDB --outdir ./examples/gtdb_example1/

# NCBI
treeprofiler.py annotate --tree examples/spongilla_example/spongilla_example.nw --metadata examples/spongilla_example/spongilla_example.tsv --taxonomic_profile --taxon_delimiter .  --taxa_field 0 --taxadb NCBI --outdir ./examples/spongilla_example/


## Visualize
treeprofiler.py plot --tree examples/gtdb_example1/gtdb_example1_annotated.nw --taxonrectangular_layout

treeprofiler.py plot --tree examples/gtdb_example1/gtdb_example1_annotated.nw --taxonclade_layout
TreeProfiler allows users to perform conditional process based on different circumstances
-
Conditional pruning, conditional pruning works both
annotateandplotsubcommand--pruned_by, prune the annotated tree by conditions, and remove the branches or clades which don't fit the condition.--rank_limit, prune the taxonomic annotated tree based on rank of classification.
-
Conditional collapsing, conditional collapsing works in
plotsubcommand, allow users to collapsed tree internal nodes to clade under customized conditions--collapsed_by, collapse tree branches whose nodes if the conditions, mainly on internal nodes
-
Conditional highlight, conditional highlight works in
plotsubcommand, allow users to highlight tree nodes under customized conditions--highlighted_by, select tree nodes which fit the conditions
All the conditional query shared the same syntax, a standard query consists the following
--pruned_by|collapsed_by|highlighted_by "<left_value> <operator> <right_value>"
- left value, the property of leaf node or internal node
- operators
=!=>>=<<=contains
- right value, custom value for the condition
Example
## annotate tree
treeprofiler.py annotate --tree examples/basic_example1/basic_example1.nw --metadata examples/basic_example1/basic_example1.tsv --bool_prop bool_type --counter_stat relative -o examples/basic_example1/

# Conditional pruning, prune leaf node whose name contain "FALPE"
treeprofiler.py plot --tree examples/basic_example1/basic_example1_annotated.ete --tree_type ete --pruned_by "name contains FALPE"

# Conditional highlight
# select tree node whose name contains `FALPE` character
treeprofiler.py plot --tree examples/basic_example1/basic_example1_annotated.ete --tree_type ete --highlighted_by "name contains FALPE"

# select tree node whose sample1 feature > 0.50
treeprofiler.py plot --tree examples/basic_example1/basic_example1_annotated.ete --tree_type ete --highlighted_by "sample1 > 0.50"
Query in internal nodes' properties is also available, in this case, left_value of query will be the internal node property, remember to add the proper suffixes such as _avg, _max,etc, for the numerical data or _counter for categorical and boolean data.
Example
# select tree internal node where sample1_avg feature < 0.50
treeprofiler.py plot --tree examples/basic_example1/basic_example1_annotated.ete --tree_type ete --heatmap_layout sample1 --collapsed_by "sample1_avg < 0.50"
Syntax for internal node counter data
# collapse tree internal nodes, where `high` relative counter > 0.35 in random_type_counter property
treeprofiler.py plot --tree examples/basic_example1/basic_example1_annotated.ete --tree_type ete --collapsed_by "random_type_counter:high > 0.35"
The syntax for the AND condition and OR condition in TreeProfiler is:
AND condition will be under one argument, syntax seperated by ,, such as
# select tree  node where sample1 feature > 0.50 AND sample2 < 0.2
treeprofiler.py plot --tree examples/basic_example1/basic_example1_annotated.ete --tree_type ete --heatmap_layout sample1,sample2,sample3,sample4,sample5 --highlighted_by "sample1>0.50,sample2<0.2"
OR condition will be used more than one arguments
# select tree node where sample1 feature > 0.50 OR sample2 < 0.2
treeprofiler.py plot --tree examples/basic_example1/basic_example1_annotated.ete --tree_type ete --heatmap_layout sample1,sample2,sample3,sample4,sample5 --highlighted_by "sample1>0.50" --highlighted_by "sample2<0.2"
Prune taxonomic annotated tree based on following taxonomic rank level,
kingdom, phylum, class, order, family, genus, species, subspecies
# Case in GTDB

# prune tree in visualization, rank limit to family level
treeprofiler.py plot --tree examples/gtdb_example1/gtdb_example1_annotated.nw  --rank_limit family --taxonclade_layout

# Case in NCBI

# prune tree in visualization, rank limit to phylum level
treeprofiler.py plot --tree examples/spongilla_example/spongilla_example_annotated.nw --rank_limit phylum --taxonclade_layout
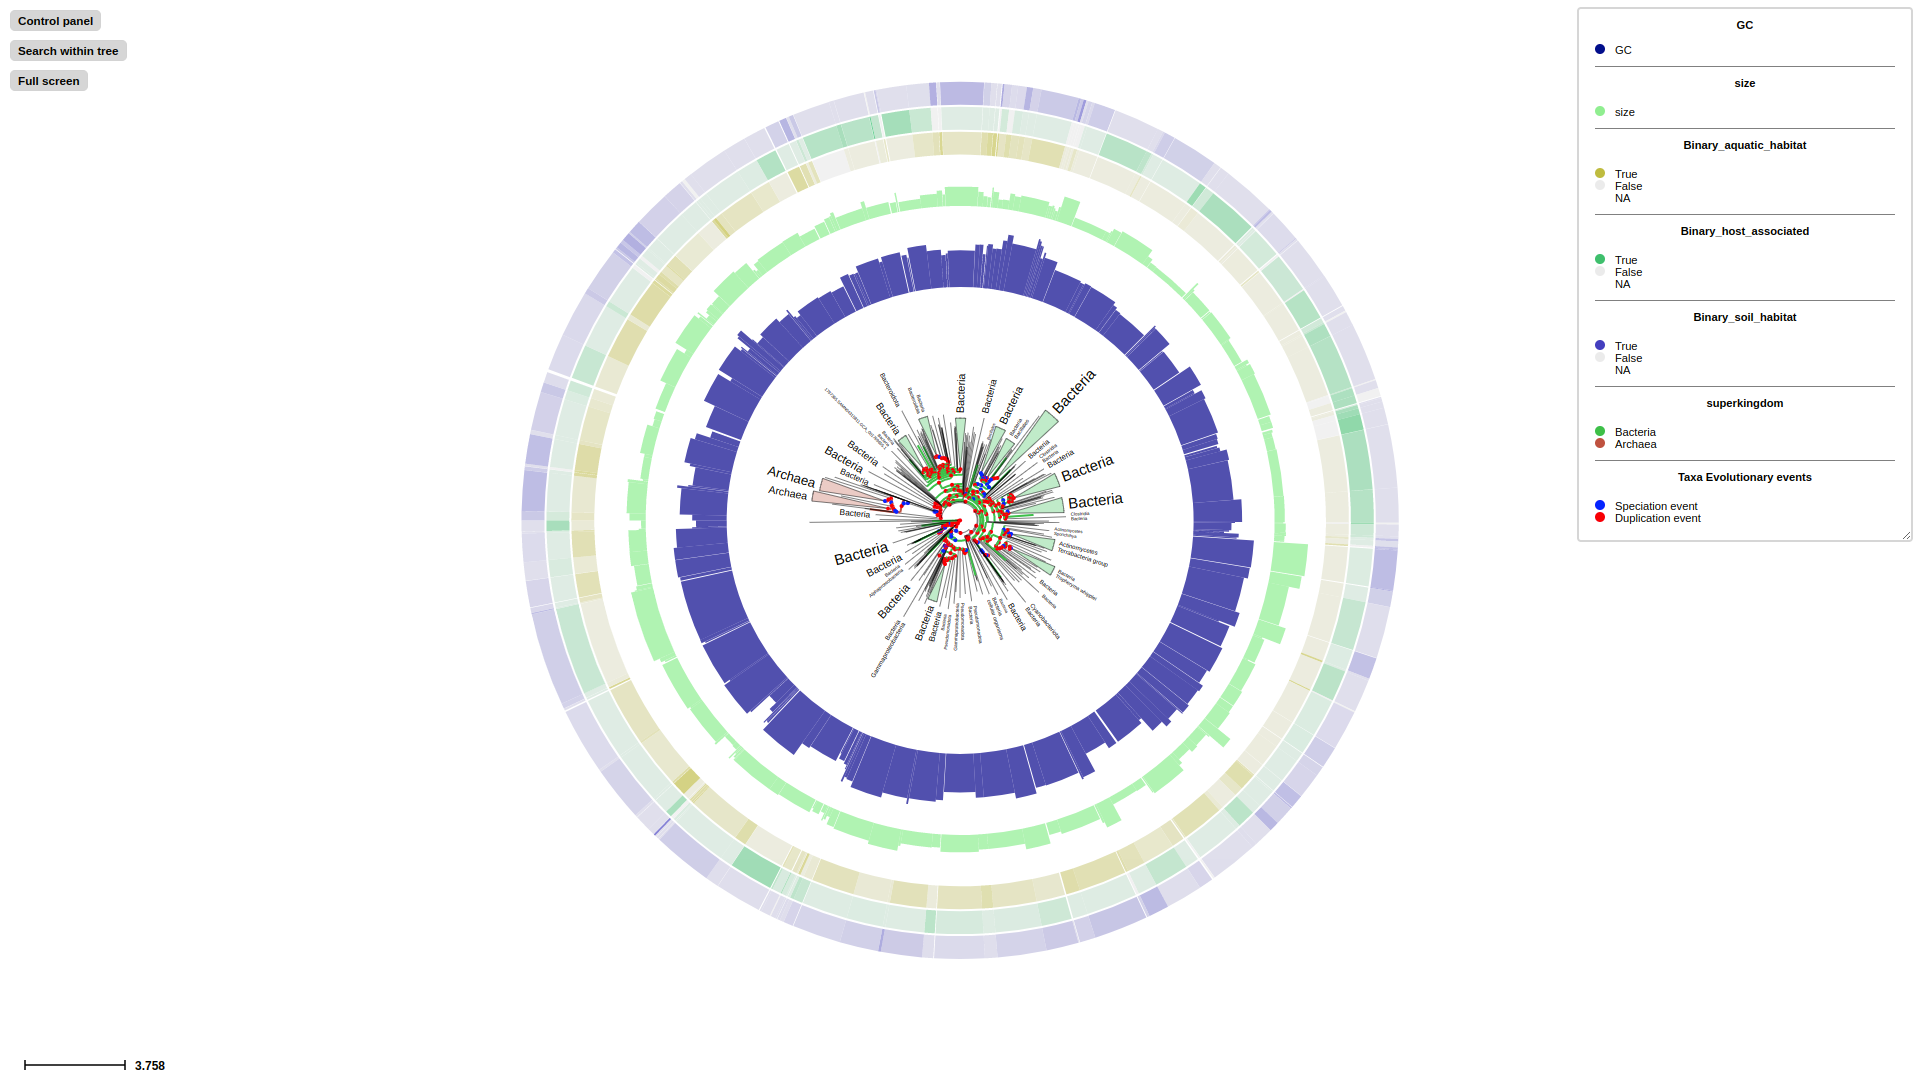
We store progenome v3 data in examples/ directory for exploration,
A glance of metadata
head -2 examples/progenome3.tsv
name    GC      GCA     aquatic_habitat host_associated size    soil_habitat    GCF
2486577.SAMN10347832.GCA_004210275.1    40.8    GCA_004210275.1 0       1       1375759 0       RS_GCF_004210275.1
2759495.SAMN15595193.GCA_014116815.1    34.3    GCA_014116815.1                 1928597         GB_GCA_014116815.1
Here we will conduct the profiling with two command line
treeprofiler.py annotate --tree examples/progenome3/progenome3.nw --metadata examples/progenome3/progenome3.tsv --taxonomic_profile --taxadb NCBI --taxon_delimiter . --taxa_field 0 --num_prop GC,size --bool_prop aquatic_habitat,host_associated,soil_habitat --outdir examples/progenome3/

treeprofiler.py plot --tree examples/progenome3/progenome3_annotated.ete --tree_type ete --barplot_layout GC,size --binary_layout aquatic_habitat,host_associated,soil_habitat --taxonclade_layout
treeprofiler.py annotate --tree examples/emapper/7955.ENSDARP00000116736.nw --emapper_annotations examples/emapper/7955.out.emapper.annotations

treeprofiler.py plot --tree examples/emapper/7955.ENSDARP00000116736_annotated.ete --tree_type ete --emapper_layout
Here we take a glance of examples/gtdb_example2/taxonomy_and_metallophores.tsv(Zachary L. Reitz, 2023). We would like to see distribution of metallophores dataset among bacteria taxonomy
head examples/gtdb_example2/taxonomy_and_metallophores.tsv
Assembly	NRP.met	NRPS	HYDROXAMATE	SALICYLATE	OHASP	OHHIS	PYOVERDINE	CATECHOL	GRAMININE	DMAQ	K	P	C	O	F	G
RS_GCF_000067165.1	2	6	FALSE	FALSE	TRUE	FALSE	FALSE	TRUE	FALSE	FALSEBacteria	Myxococcota	Polyangia	Polyangiales	Polyangiaceae	Sorangium
RS_GCF_001189295.1	0	12	FALSE	FALSE	FALSE	FALSE	FALSE	FALSE	FALSE	FALSEBacteria	Myxococcota	Polyangia	Polyangiales	Polyangiaceae	Chondromyces
# annotate tree
treeprofiler.py annotate --tree examples/gtdb_example2/bac120.tree --metadata examples/gtdb_example2/taxonomy_and_metallophores.tsv -o examples/gtdb_example2/ --taxonomic_profile

# plot tree
treeprofiler.py plot --tree examples/gtdb_example2/bac120_annotated.ete --tree_type ete --barplot_layout NRP.met,NRPS --binary_layout HYDROXAMATE,SALICYLATE,OHASP,OHHIS,PYOVERDINE,CATECHOL,GRAMININE,DMAQ --rectangular_layout P


