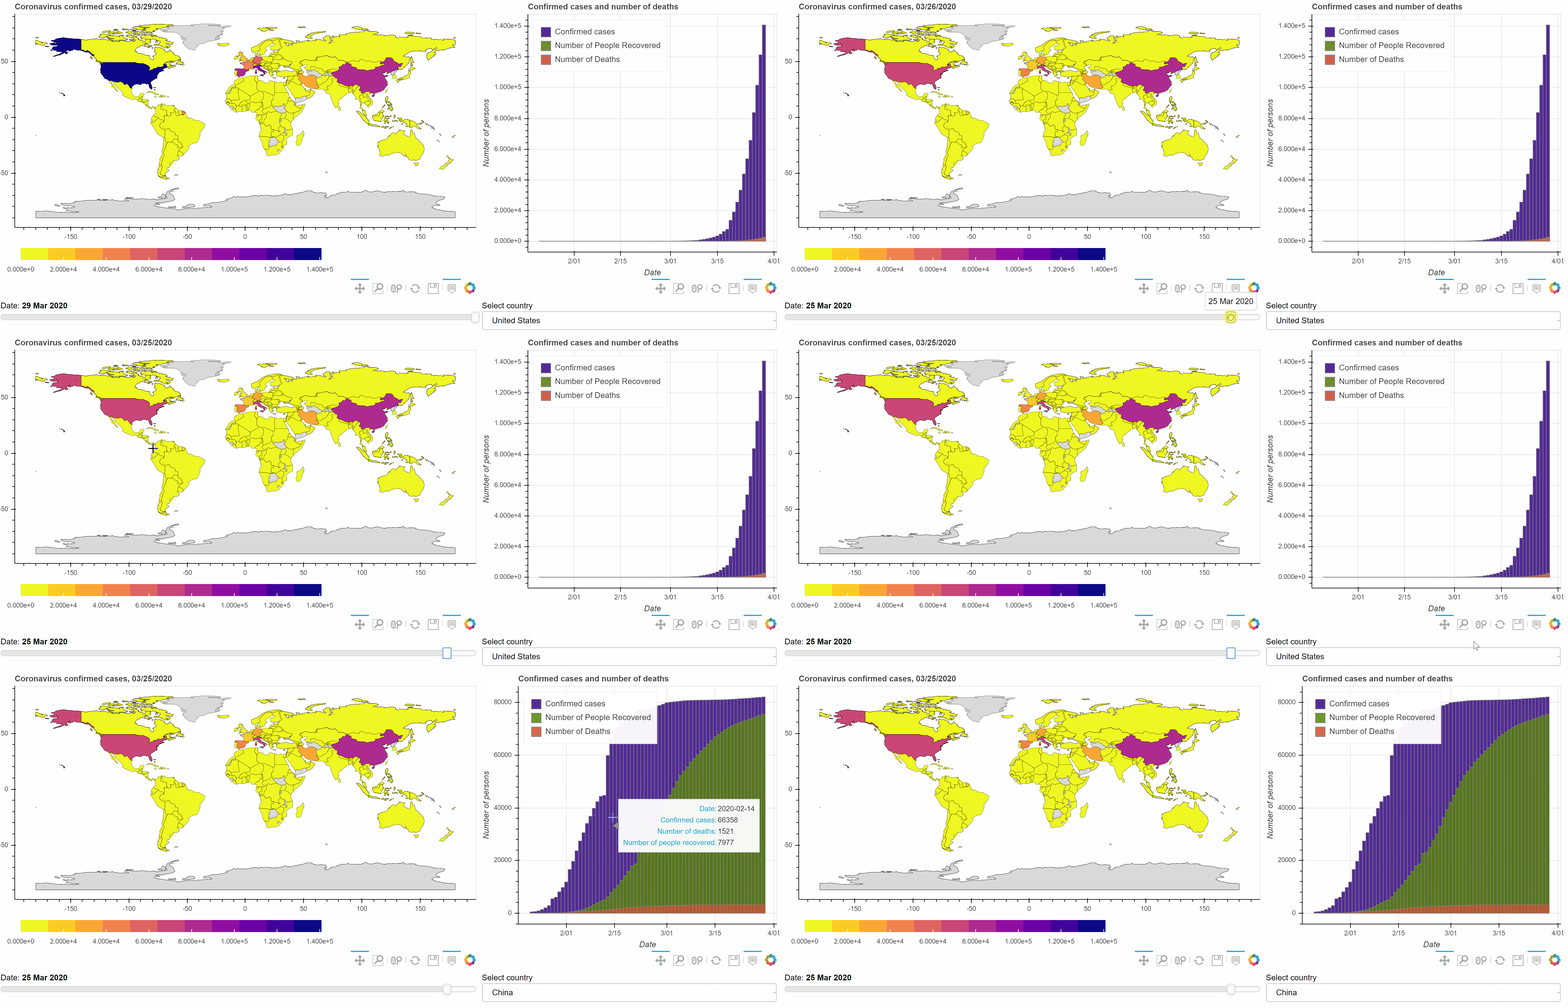
Interactive world visualization for the spread of COVID-19 virus statistics.
The visualization is comprised of two parts:
- World map: allows you to see a world map color-based of the number of confirmed cases in every country country. The darker de color, the higher this statistic. It has a slider tool that allows the user to select the specific date at which you'd like to explore the statistics. At the same time it presents a hover tool functionality that allows to move the cursor over the countries and see that country's name and the number of deaths for the selected date.
- Bar chart: A stacked bar plot indicating the number of confirmed cases, deaths and recovered people for a specific country selected on a drop down menu.
When running the visualization, the data is automatically loaded from: https://data.humdata.org/dataset/novel-coronavirus-2019-ncov-cases, making sure it's up to date with the latest numbers.
To run the visualization locally please run the following command in the project directory:
bokeh serve --show scr/covid_19.py
