py_d3 is an IPython extension which adds D3 support to the Jupyter Notebook environment.
D3 is a well-known and -loved JavaScript data visualization and document object manipulation library which makes it possible to express even extremely complex visual ideas simply using an intuitive grammar. Jupyter is a browser-hosted Python executable environment which provides an intuitive data science interface.
These libraries are foundational cornerstones of web-based data visualization and web-based data science, respectively. Wouldn't it be great if we could them to work together? This module does just that.
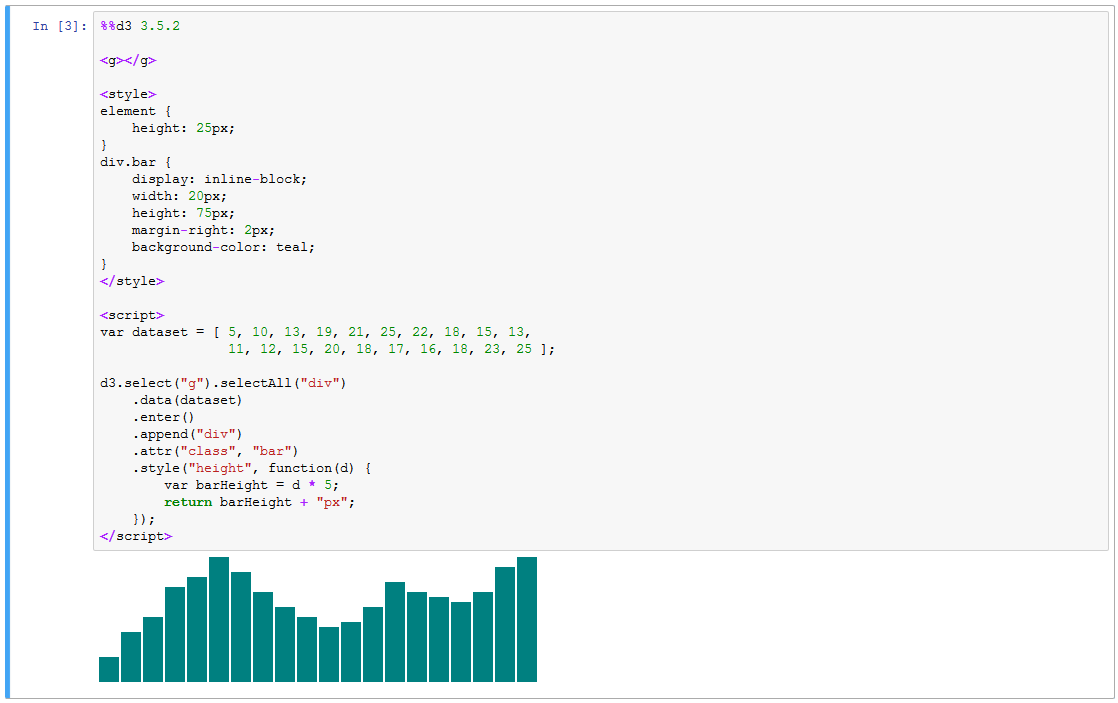
To create a D3 block in your notebook, add the %%d3 cell magic to the top of the cell:
To choose a specific version of D3, append the version number onto the end of the line:
Both 3.x and 4.x versions of D3 are supported. Note, however, that you may only run one version of D3 per notebook.
py_d3 allows you to express even very complex visual ideas within a Jupyter Notebook without much difficulty.
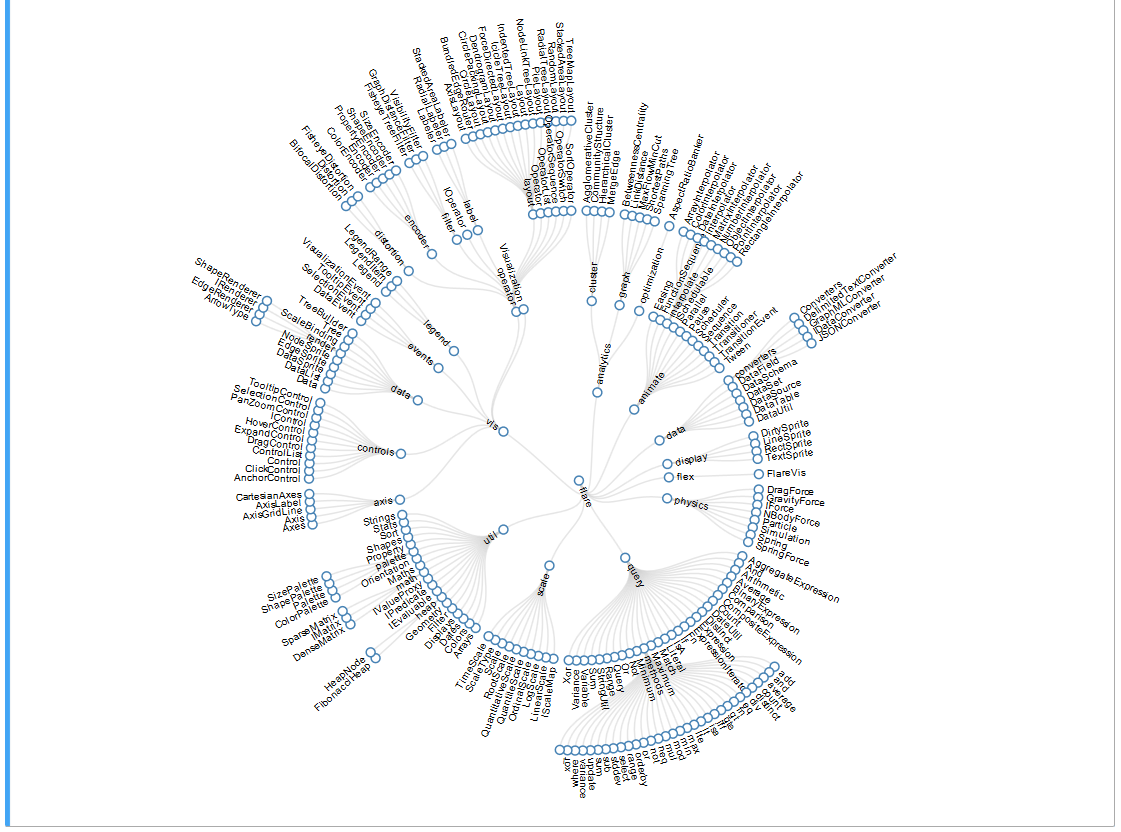
A Radial Reingold-Tilford Tree, for example:
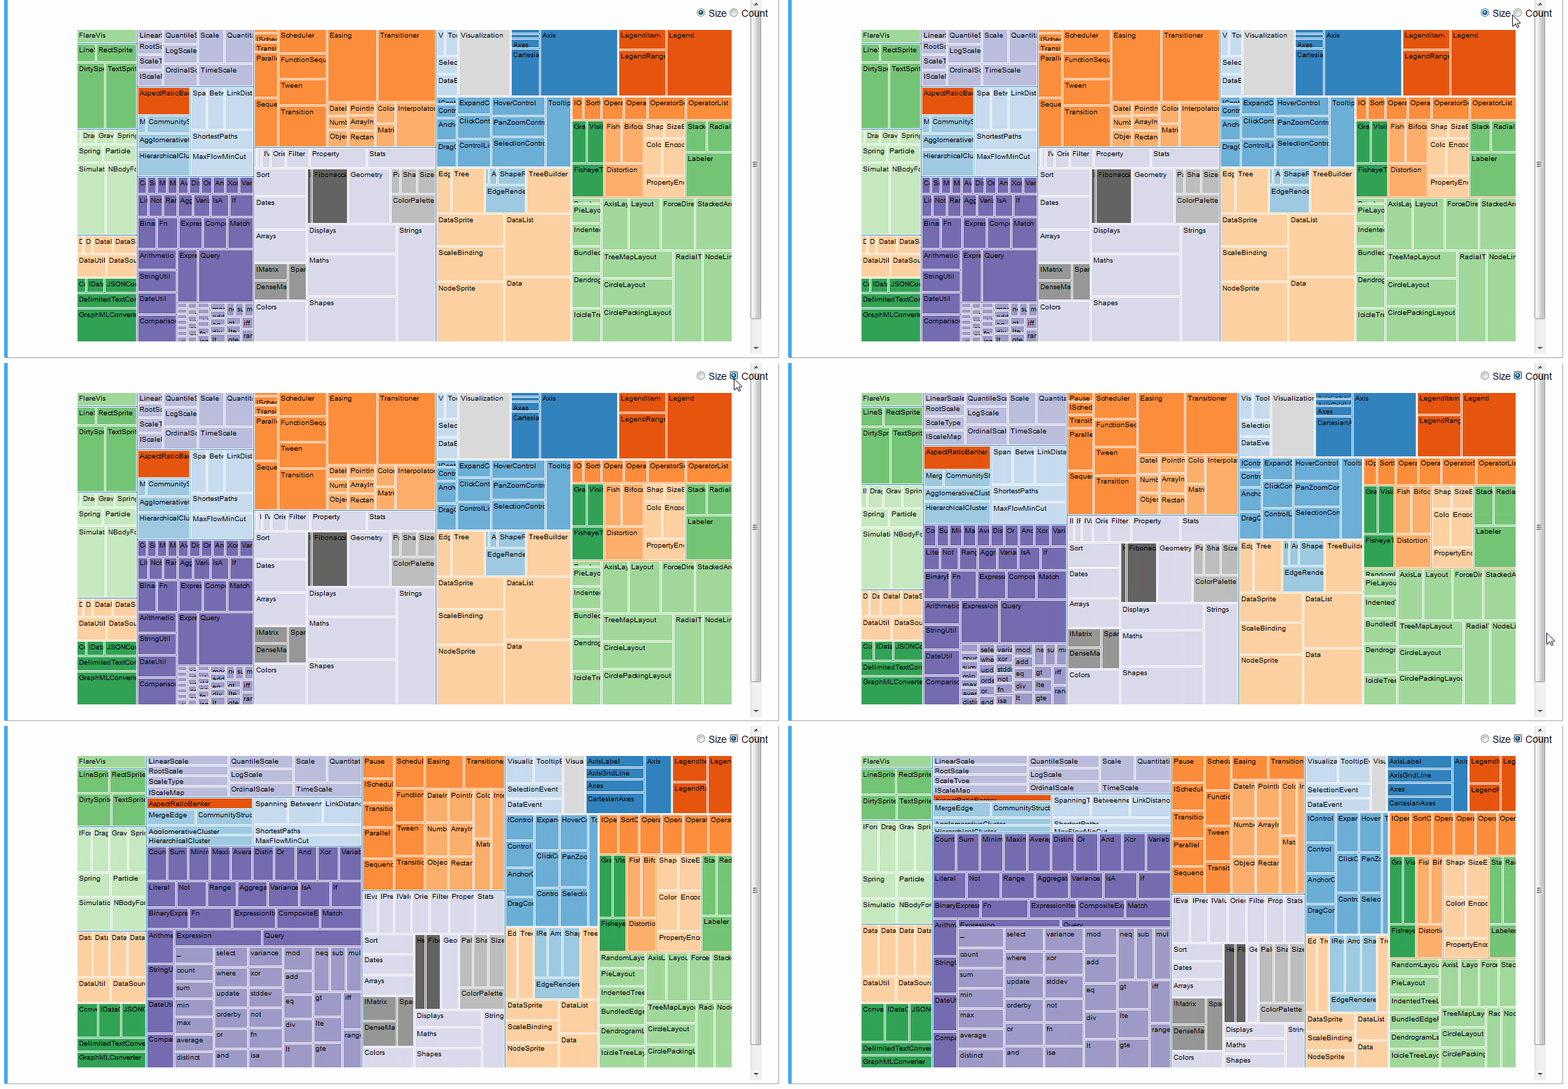
An interactive treemap (original):
Or even the entire D3 Show Reel animation:
For more examples refer to the examples notebooks.
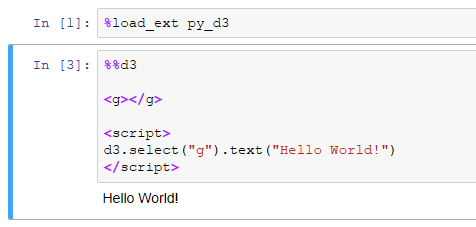
The easiest way to get py_d3 is to pip install py_d3 and then run %load_ext py_d3 in Jupyter Notebook.
Most HTML-hosted D3 visualizations, even very complex ones, can be made to run inside of a Jupyter Notebook %%d3 cell with just two modifications:
- Remove any D3 imports in the cell (e.g.
<script src="https://d3js.org/d3.v3.js"></script>). D3 is initialized at cell runtime by the%%d3cell magic (3.5.11by default, you can specify a specific version via line parameter, e.g.%%d3 3.4.3). - Since an HTML document can only have one
<body>tag, and it's already defined in the Jupyter framing, variants ofd3.select("body").append("g")won't work. Workaround: define an<g>element yourself and then dod3.select("g")instead.
These changes alone were sufficient to import the visualizations presented here and in the examples.
Jupyter notebooks allow executing arbitrary JavaScript code using IPython.display.JavaScript, however it makes no effort to restrict the level of DOM objects accessible to executable code. Thus if you ran, for instance, %javascript d3.selectAll("div").remove();, you would target and remove all div elements on the page, including the ones making up the notebook itself!
This plugin attempts to improve on a few existing Jupyter-D3 bindings by restricting d3 scope to whatever cell you are running the code in. It achieves this by monkey-patching subselection over the core d3.select and d3.selectAll methods (see this comment by Mike Bostock for ideation).
py_d3, though thoroughly capable, has a lot of quirks:
- Force graphs don't work at all. Use
ipython-d3networkxinstead. - You will need to run your cells first before your plots will show up.
- D3 cells generated via
Run Allmay fail. Run the cell individually instead. - You probably will have to run the first
%%d3cell on the page twice. - Your version of D3 will be cached. To load a different version, purge your cache.
- If you have multiple D3 cells in your notebook, make sure that each one starts with the same
%%d3 <VERSION>magic! See Issue #4.
The codebase is actually very simple. Pull requests welcome!
MIT.


