Author: Jeff Erickson <[email protected]>
I am from Missoula County, Montana, which had a population of 109,299 in the 2010 United States Census. Now that I live in Brooklyn, NY, I often get the question: "Did you grow up on a farm?" I usually say, "No, Missoula is a college town with about 70,000 people." To this, the inevitable comparison to other towns --- often suburbs --- comes up. "Oh, that's not that bad. That's bigger than White Plains!"
The difference between Missoula, Montana and White Plains, New York may be obvious, yet this type of reply is common. So what is the difference? I usually say, "Well, yes, but White Plains is just outside of one of the largest cities in the world, while Missoula is a 7-hour drive to its closest city." But what is the best way to measure this difference? This is the primary motivation of this project.
In addition, I've wanted to try a mapping project in R for sometime, so this also felt like a great opportunity to learn about mapping with census boundary files and ggplot2.
For the initial version, I decided to use a ratio of county density and distance to closest primary statistical area with population over 2 million within the United States. While the map produced results similar to what I expected, it was too heavily weighted by the county densities creating a skewed distribution of the ratio and a few outlier counties that would normally not be thought of as "urban." In the end, it was mostly just a map of the densest counties.

In doing some research for Version 2, I came across a paper by Brigitte S. Waldorf defining the Index of Relative Rurality (link below). With that as background, I decided to modify my measure to be a simple average of the standardized distance to the closest primary staistical area (though mirrored so that higher meant more urban) and the standardized logarithm of the density. This produced a much "smoother" (the index was now normally distributed) map than Version 1 and eliminated the outliers mentioned before.

While Version 2 was better than Version 1, I still felt that there wasn't enough differentiation among rural counties that are relatively populated when compared to the rest of the otherwise rural state. For example, looking at Montana, the population centers (which are not large compared with the rest of the country) were almost identical to the counties in Montana that are rural even by Montana standards.
To improve upon this, I used Waldorf's method of including the standardized logarithm of county population in addition to the other two measures from Version 2. This lead to an improved measure which continues to be "smooth," doesn't have as many outliers, and still can differentiate in places like Montana.

One problem still remained: the distances are "as the crow flies." When measuring rurality, how long it takes to travel matters more than the straight distance to the nearest city. The largest differences between these two measures are likely to be in the more mountainous regions (where the roads are not straight) or areas that are very far from a city (since the magnitude of the difference will have a chance to become significant). In order to factor this into the index, I calculated the driving distances using the Google Maps API (for more information, see the County/City Driving Distance Dataset).
Calculating the index with both distance methodologies produced very similar results (all within +/- 0.07). Here is a map showing the counties and their difference between the two methodologies:

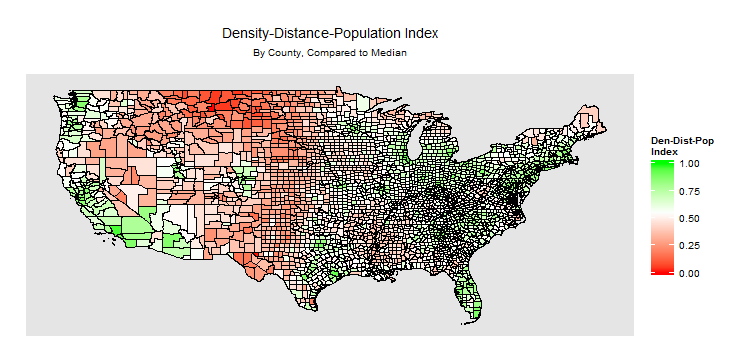
Areas around the Rocky Mountains and northern Montana (the "High Line") appear to be the hardest hit by this change. The last addition I decided to make was to add a third color to show the relation of each county's index to the median index. Here is the final map using the new distance methodology as well as the third color:
Here is the density curve of the index itself:

Missoula County is below the national mean (0.53) at 0.44, and well below Westchester County (home of White Plains).
The most rural counties by this metric are:
| FIPS Code | Den-Dist-Pop Index | County Name |
|---|---|---|
| 0500000US30069 | 0.0000000 | Petroleum County, Montana |
| 0500000US48301 | 0.0079498 | Loving County, Texas |
| 0500000US30019 | 0.0455225 | Daniels County, Montana |
| 0500000US30033 | 0.0484002 | Garfield County, Montana |
| 0500000US30071 | 0.0516089 | Phillips County, Montana |
| 0500000US30055 | 0.0681927 | McCone County, Montana |
And the least rural counties are:
| FIPS Code | Den-Dist-Pop Index | County Name |
|---|---|---|
| 0500000US17031 | 0.9627766 | Cook County, Illinois |
| 0500000US06037 | 0.9629203 | Los Angeles County, California |
| 0500000US36005 | 0.9664776 | Bronx County, New York |
| 0500000US36081 | 0.9697877 | Queens County, New York |
| 0500000US36047 | 0.9955787 | Kings County, New York |
| 0500000US36061 | 1.0000000 | New York County, New York |
Interesting to note is that 5 of the 6 most rural counties are in eastern Montana, and 4 of the 6 least rural counties are in New York City (4 of the 5 boroughs). The metric was able to successfully differentiate between Staten Island (the borough that didn't make the cut) and the 2nd and 3rd largest cities in the country.
I'll end with a map showing which counties are more and less rural than Missoula County:

The full Density-Distance-Population Index per County dataset can be downloaded here.
A Continuous Multi-dimensional Measure of Rurality: Moving Beyond Threshold Measures. Waldorf, Brigitte S. 2006. (link)
County/City Driving Distance Dataset. Erickson, Jeffrey P. 2014. (link)