This webpart uses the Chart.js library to visualize SharePoint list data.
Built in Chart Types: -Bar -Horizontal Bar -Doughnut -Line -Pie -Polar -Radar
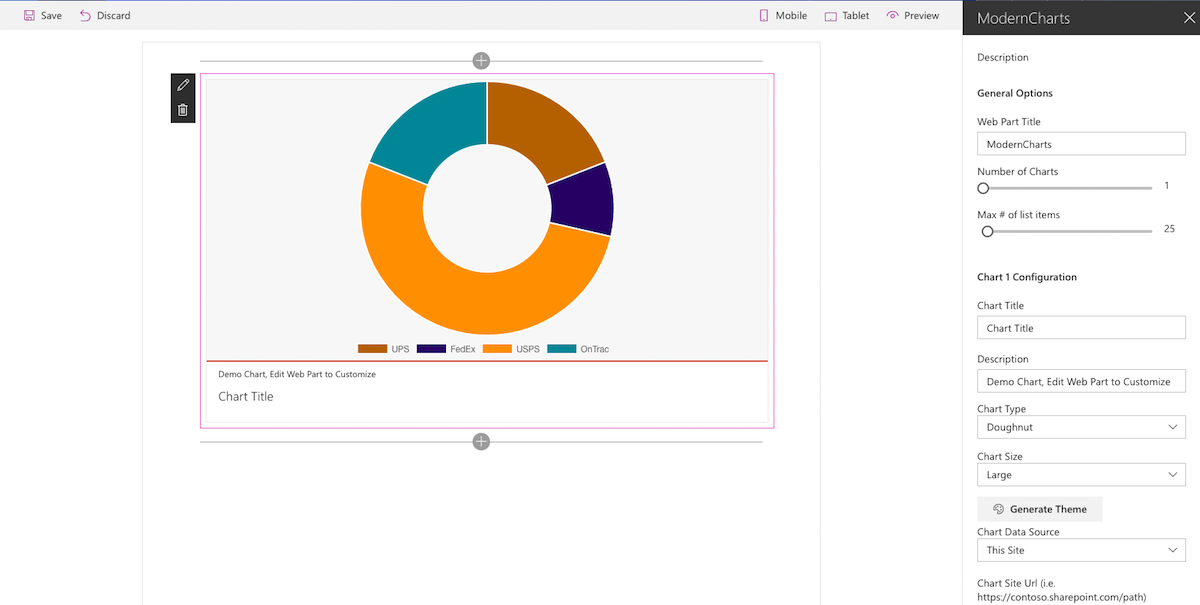
Each chart is uniquely themed with the built-in color theme generator (color-scheme), continue generating a theme until you find one to your liking.
New charts are populated with Sample data, select a site (or define a custom path with the Other option), a list data source, label column, data column and which column indicates a unique value in your list. See the demo below for an example.
Current Data Functions: -Average -Count -Sum

Built with SharePoint Framework GA, Office Graph, React and Chart.JS
| Solution | Author(s) |
|---|---|
| react-modern-charts | Jeremy Coleman (MCP, PC Professional, Inc.) |
| Version | Date | Comments |
|---|---|---|
| 1.0.0.0 | February 11, 2017 | Initial release |
THIS CODE IS PROVIDED AS IS WITHOUT WARRANTY OF ANY KIND, EITHER EXPRESS OR IMPLIED, INCLUDING ANY IMPLIED WARRANTIES OF FITNESS FOR A PARTICULAR PURPOSE, MERCHANTABILITY, OR NON-INFRINGEMENT.
- SharePoint Online tenant with Office Graph content enabled
- clone this repo
$ npm i$ gulp serve- if deploying to Office 365, upadte the CDN path in write-manifests.json
Sample Web Parts in this solution illustrate the following concepts on top of the SharePoint Framework:
- using React for building SharePoint Framework Client-Side Web Parts
- using Office UI Fabric React components for building user experience consistent with SharePoint and Office
- communicating with SharePoint using its REST API
- passing Web Part properties to React components
- building dynamic web part properties