


Library for plotting multiple ranks evolved over processing steps - drawing a rankflow.
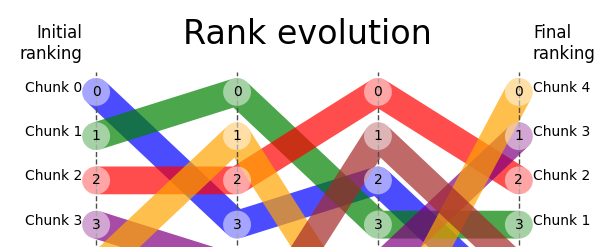
RankFlow is a Python package that allows you to create rank flow plots (bump charts), helping visualize the changes in ranking of nodes.
Initially it was applied to re-ranking visualization of nodes (parts of documents, document chunks) during the retrieval and re-ranking processes within a Retrieval Augmented Generation (RAG) retriever, but the usage is not limited to RAG.
⭐️ Please star the repository if you find it useful.
pip install rankflowStart with creating pandas DataFrame with ranks for each document at each step.
import pandas as pd
import matplotlib.pyplot as plt
from rankflow import RankFlow

data = {"Doc 1": [2, 1, 3, 2], "Doc 2": [1, 2, 1, 3], "Doc 3": [3, 3, 2, 1]}
df = pd.DataFrame(data, index=["Step_1", "Step_2", "Step_3", "Step_4"])
This creates the following DataFrame:
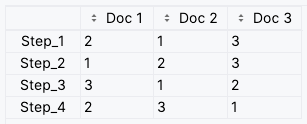
NOTE: The rows of the DataFrame are the steps and the columns are the documents. The values are the ranks of the documents at each step. Remember to define proper column names and index values since they will be used as labels in the plot.
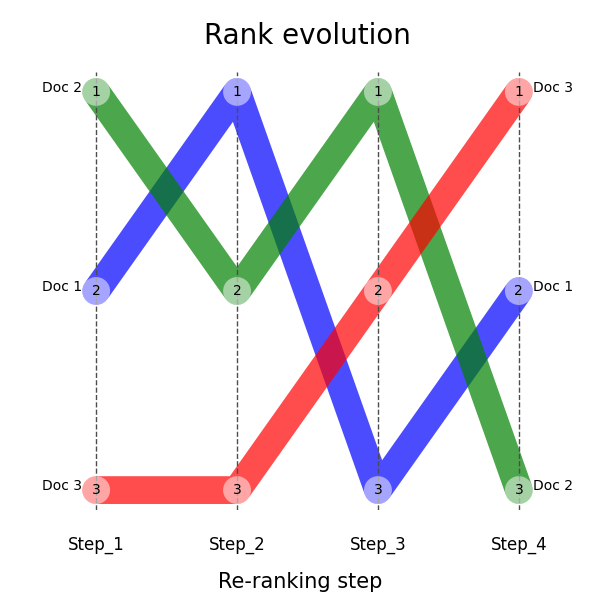
When the DataFrame is ready, then it is time to create RankFlow object and call plot() method.
rf = RankFlow(df=df)
rf.plot()

# save the plot to png
plt.savefig("rankflow.png")

plt.show()
Here is the expected output:
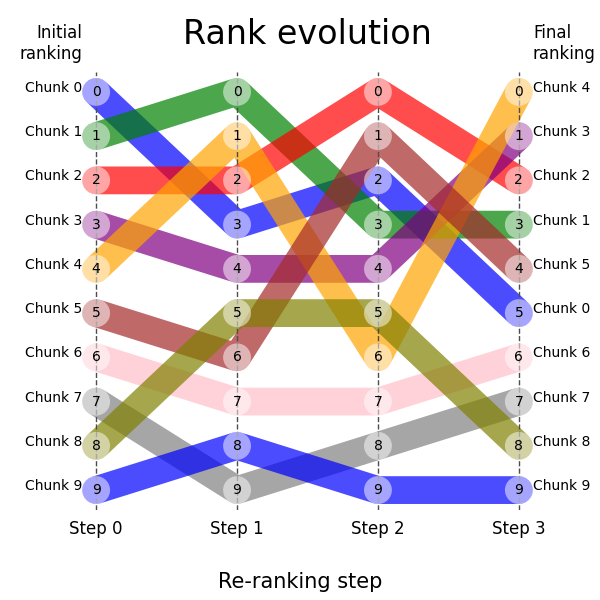
You can also create RankFlow object without using pandas DataFrame. You can pass numpy array with ranks for each document at each step and provide labels for steps and documents.
import matplotlib.pyplot as plt
from rankflow import RankFlow
import numpy as np

my_step_labels: list[str] = [
    "Hybrid Search",
    "Cross-encoder",
    "Graph-reranker",
    "Booster",
]
my_chunk_labels: list[str] = [
    "Doc 0",
    "Doc 1",
    "Doc 2",
    "Doc 3",
    "Doc 4",
    "Doc 5",
    "Doc 6",
    "Doc 7",
    "Doc 8",
    "Doc 9",
]
my_ranks = np.array(
    [
        [0, 1, 2, 3, 4, 5, 6, 7, 8, 9],
        [3, 0, 2, 4, 1, 6, 7, 9, 5, 8],
        [2, 3, 0, 4, 6, 1, 7, 8, 5, 9],
        [5, 3, 2, 1, 0, 4, 6, 7, 8, 9],
    ]
)

rf = RankFlow(
    ranks=my_ranks,
    step_labels=my_step_labels,
    chunk_labels=my_chunk_labels,
    fig_size=(6, 6),
    title_font_size=24,
)
_ = rf.plot()
plt.show()
This should produce the following plot:
There is and blog article describing usage of this package in RAG retriever: RankFlow plot for retriever visual evaluation that might be helpful if you are wondering how to efficienty track rank changes in your retriever and finally visualize them.