Optimised consensus clustering of one or more heterogeneous datasets
- What does Clust do?
- How does Clust do it?
- Install Clust
- Run Clust
- Normalisation
- Handling replicates
- Data from multiple species
- Data from multiple technologies (e.g. mixing RNA-seq and microarrays)
- Handling missing genes
- Handling genes with low expression
- Are you obtaining noisy clusters?
- List of all parameters
- Example datasets
- Citation
Clust is a fully automated method for identification of clusters (groups) of genes that are consistently co-expressed (well-correlated) in one or more heterogeneous datasets from one or multiple species.
Figure 1: Clust processes one gene expression dataset to identify (K) clusters of co-expressed genes. Clust automatically identifies the number of clusters (K).
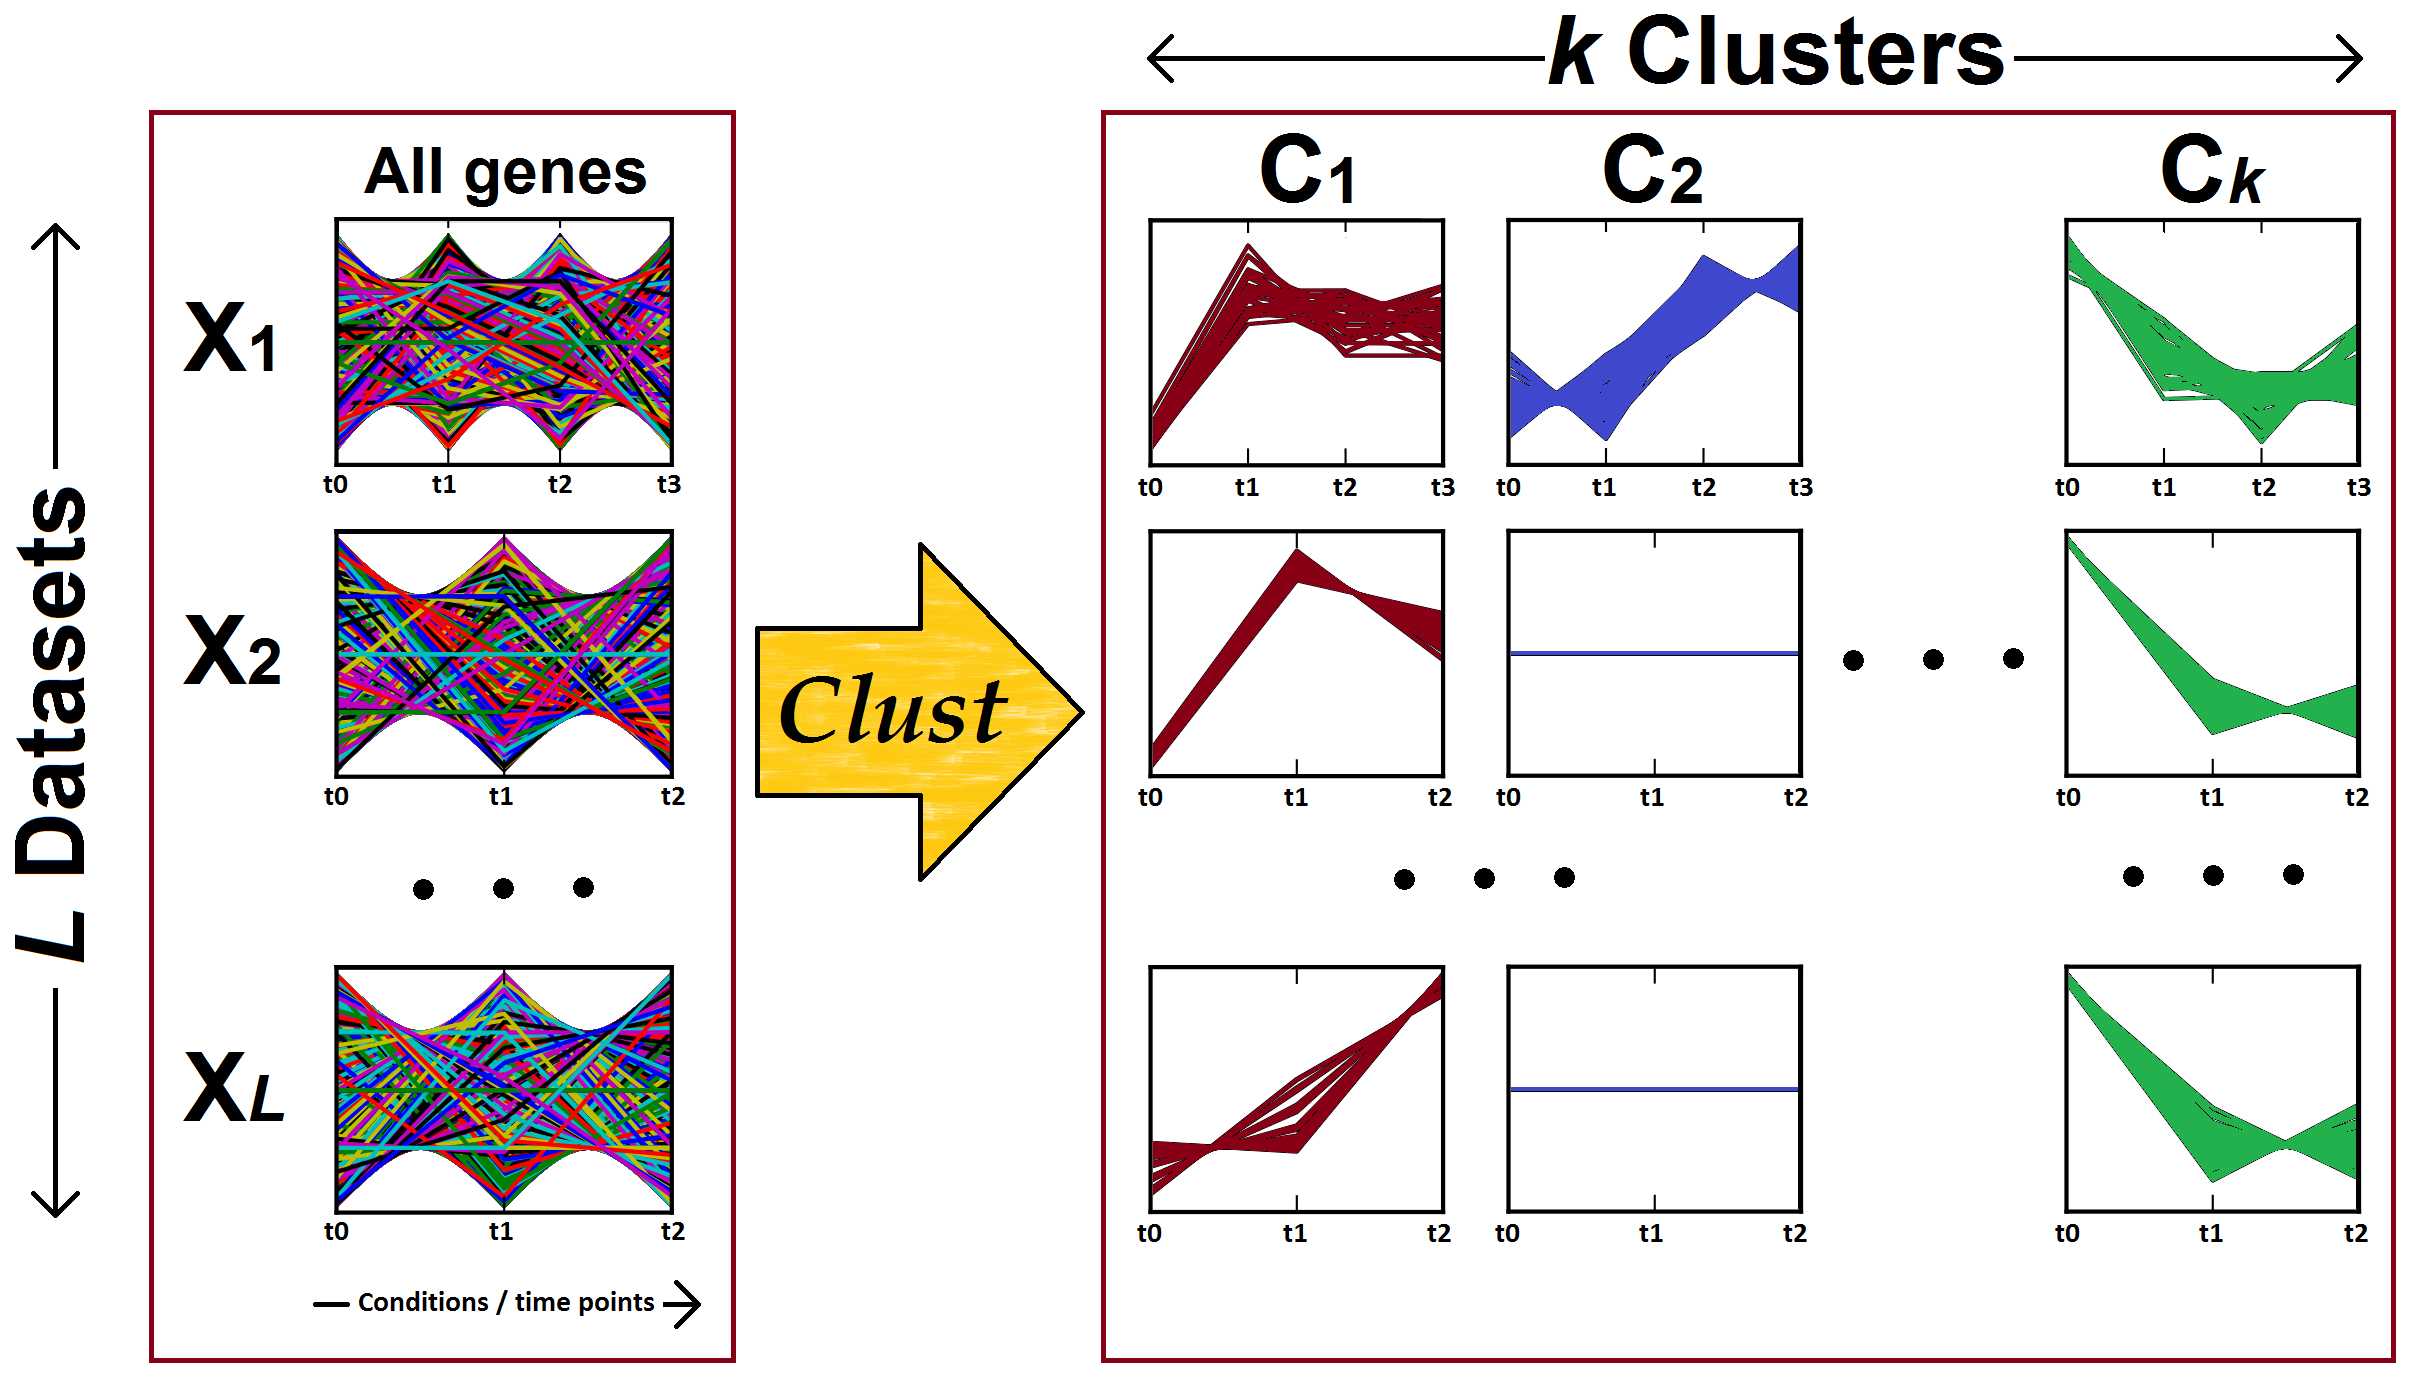
Figure 2: Clust processes multiple gene expression datasets (X1, X2, ... X(L)) to identify clusters of genes that are co-expressed (well-correlated) in each of the input datasets. The left-hand panel shows the gene expression profiles of all genes in each one of the input datasets, while the right-hand panel shows the gene expression profiles of the genes in the clusters (C1, C2, ... C(k)). Note that the number of conditions or time points are different for each dataset.
-
No need to pre-process your data; clust automatically normalises the data.
-
No need to preset the number of clusters; clust finds this number automatically.
-
You can control the tightness of the clusters by varying a single parameter
-t -
It is okay if the datasets:
- Were generated by different technologies (e.g. RNA-seq or microarrays)
- Are from different species
- Have different numbers of conditions or time points
- Have multiple replicates for the same condition
- Require different types of normalisation
- Were generated in different years and laboratories
- Have some missing values
- Do not include every single gene in every single dataset
-
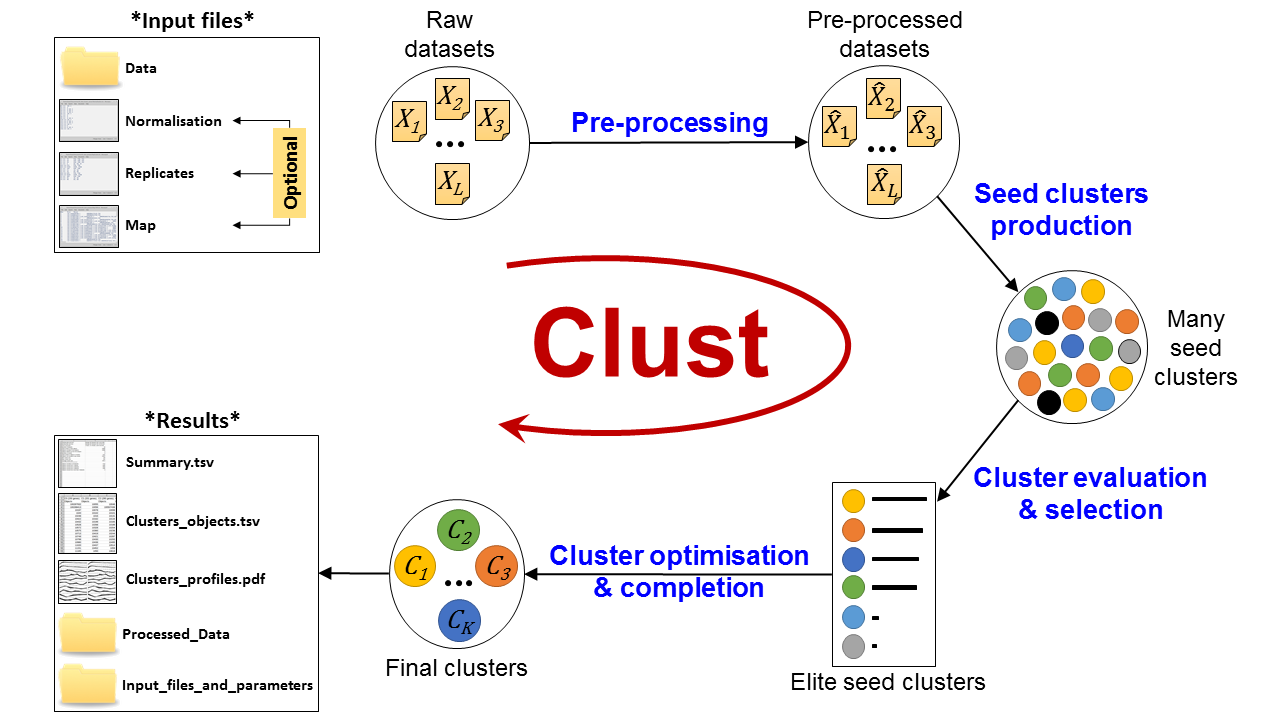
Clust generates the following output files:
- A table of clustering statistics
- A table listing genes included in each cluster
- Pre-processed (normalised, summarised, and filtered) datasets' files
- Plotted gene expression profiles of clusters (a PDF file)
Figure 3: Automatic Clust analysis pipeline
Clust is a Python package, which requires Python 2.7 or newer and depends on these Python packages:
- numpy
- scipy
- matplotlib
- sklearn
- sompy
- joblib
- portalocker
You can check if you have these packages by:
pip freeze
Use this, for example, to install clust on a server for all users.
If matplotlib is not already installed, install it:
sudo apt-get install python-matplotlib
Then install clust by:
sudo pip install clust
Then you can run clust straightforwardly from any place:
clust ...
If you already have clust and want to update it, try:
sudo pip uninstall clustsudo pip install clust --no-cache-dir
This installs clust for the local user only:
pip install --user clust
If you already have clust and want to update it, try:
pip install --user clust --upgrade
Then you can run clust by:
clust ...
This works if the Python packages that clust requires are already installed (listed above).
Download the latest release file (clust-..*.tar.gz) file from the
release tab
and run the script clust.py that is in the top level directory of the source code by:
python clust.py ...
Clust has not been tried in Windows thoroughly. If you try it, your feedback will be much appreciated.
We recommend that you download and install WinPython which provides you with many Python packages that clust requires from https://winpython.github.io/
Open WinPython Powershell Prompt.exe from the directory in which you installed WinPython.
Run:
pip install clust
Then you can run clust by:
clust ...
For normalised homogeneous datasets, simply run:
clust data_pathclust data_path -o output_directory [...]
This runs clust over the datasets in the data_path directory with default parameters. If the output directory is not provided, clust creates a new directory for the results within the current working directory.
For raw RNA-seq TPM, FPKM, or RPKM data, consider the Normalisation section below. Other sections below address handling replicates, handling data from mulitple species, and handling microarray data (only or mixed with RNA-seq data).
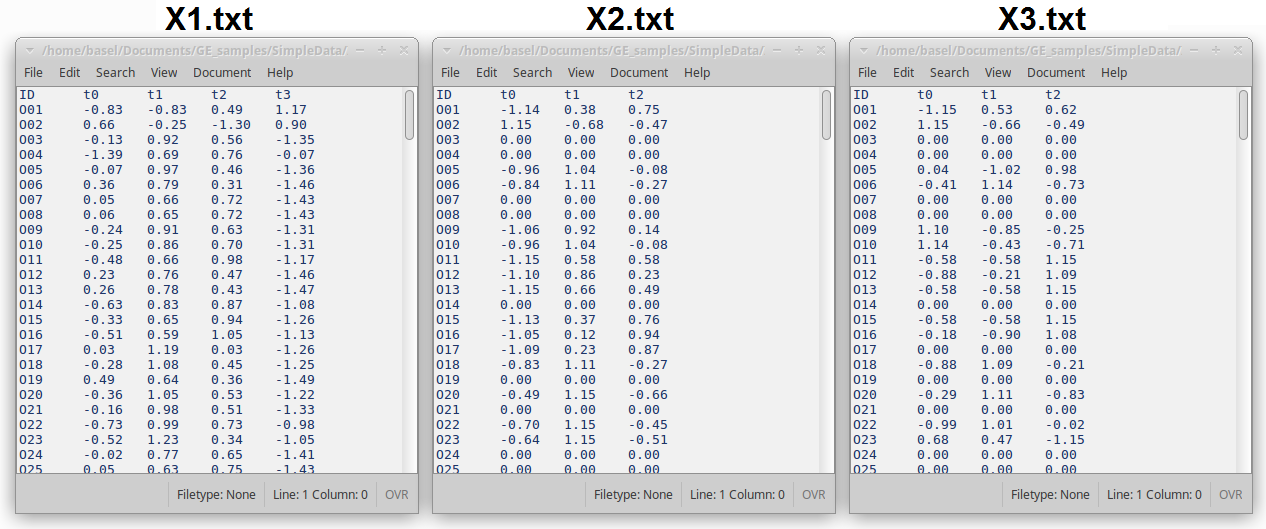
Each dataset is represented in a single TAB delimited (TSV) file in which the first column represents gene IDs, the first row represents unique labels of the samples, and the rest of the file includes numerical values, mainly gene expression values.
Figure 4: Snapshots of the first few lines of three data files X1.txt, X2.txt, and X3.txt.
- When the same gene ID appears in different datasets, it is considered to refer to the same gene.
- If more than one row in the same file had the same identifier, they are automatically summarised by summing up their values.
- IMPORTANT: Gene names should not include spaces, commas, or semicolons.
NEW FEATURE: AUTOMATIC NORMALISATION! (V1.7.0 and newer)
Clust applies data normalisation during its pre-processing step.
-
Version 1.7.0 and newer: Clust automatically detects the most suitable normalisation for each dataset unless otherwise stated by the user via the
-noption. The normalisation codes that clust decides to apply are stored in the output file/Normalisation_actual -
Version 1.6.0 and earlier: The required normalisation techniques should be stated by the user via the
-noption. Otherwise, no normalisation is applied.
Tell clust how to normalise your data in one of two ways:
-
clust data_path -n code1 [code2 code3 ...] [...](V1.7.0 and newer)- List one or more normalisation codes (from the table below) to be applied to your one or more datasets
- Example:
clust data_path -n 101 3 4 [...]
-
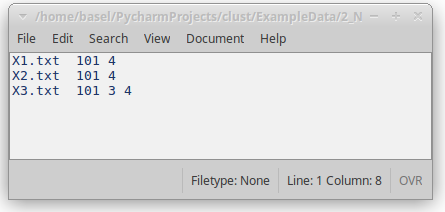
clust data_path -n normalisation_file [...]- Provide a file listing the normalisation codes for each dataset (see Fig. 5).
- Each line of the file includes these elements in order:
- The name of the dataset file (e.g. X0.txt)
- One or more normalisation codes. The order of these codes defines the order of the application of normalisation techniques.
- Delimiters between these elements can be spaces, TABs, commas, or semicolons.
Figure 5: Normalisation file indicating the types of normalisation that should be applied to each of the datasets.
- RNA-seq TPM, FPKM, and RPKM data: 101 3 4
- Log2 RNA-seq TPM, FPKM, and RPKM data: 101 4
- One-colour microarray gene expression data: 101 3 4
- Log2 one-colour microarray gene expression data: 101 4
- Two-colour microarray gene expression data: 3 6
- Log2 two-colour microarray gene expression data: 6
| Code | Definition |
|---|---|
| 0 | No normalisation (Default in v1.6.0 and earlier) |
| 1 | Divide by the mean value of the row |
| 2 | Divide by the first value of the row |
| 3 | Log2 |
| 31 | Set all values that are less than 1.0 to 1.0, then log2 (v1.7.0+) |
| 4 | Subtract the mean of the row and then divide by its standard deviation |
| 5 | Divide by the total (sum) of the row |
| 6 | Subtract the mean value of the row |
| 7 | Divide by the maximum value of the row |
| 8 | 2 to the power X |
| 9 | Subtract the minimum value of the row |
| 10 | Rank across rows (1 for the lowest, up to N for N columns; average ranks at ties) |
| 11 | Rank across rows (1 for the lowest, up to N for N columns; order arbitrarly at ties) |
| 12 | Linear transformation to the [0, 1] range across rows (0.0 for the lowest and 1.0 for the highest) |
| 13 | Set all values of genes with low expression everywhere to zeros. The threshold of low expression is found by fitting a bimodal distribution to per-gene maximum expression values over all samples (v1.7.0+) |
| - | - |
| 101 | Quantile normalisation |
| 102 | Column-wise mean subtraction |
| 103 | Subtract the global mean of the entire dataset |
| - | - |
| 1000 | Automatic detection of suitable normalisation (Default in v1.7.0 and newer) |
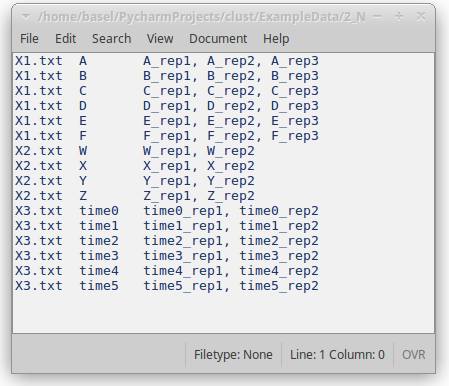
If multiple replicates exist for the same condition, include this information in a replicates file and provide it
to clust by:
clust data_path -r replicates_file [...]
Each line in the replicates file relates to the replicates of a single condition or time point, and includes these elements in order:
- The name of the dataset file (e.g. X0.txt).
- A name for the condition of time-point; this can be any label that the user chooses.
- One or more names of the replicates of this condition. These should match column names in the dataset file.
Figure 6: Replicates file
- Delimiters between these elements can be spaces, TABs, commas, or semicolons.
If your datasets come from multiple species, you can include a mapping file that defines gene mapping across species.
clust data_path -m map_file [...]
The mapping file is a TAB delimited file in which the first row shows the names of the species and the first column shows the IDs of the orthologue groups (OGs). Each OG includes zero, one, or many orthologous genes in each species' column split by commas.
Figure 7: Mapping fission and budding yeast genes
Figure 8: Mapping rice, setaria, and maize genes. Notice that some OGs do not include genes in some species
-
You can use Orthofinder to identify the OGs across multiple species. Orthofiner's output file
Orthogroups.csvcan be provided directly toclustas the mapping file. -
If some genes do not exist in some species (e.g. Figure 8), have a look at the section Genes missing from some datasets below.
Incorporating microarray data in the analysis with or without RNA-seq data can be straightforwardly done. The main point to be taken care of is to include the correct normalisation codes for the different datasets as detailed in the Normalisation section above.
Also, if the first column of the microarray data file includes probe IDs which are not identical across datasets generated by using different microarray/RNA-seq platforms, make sure that probe-gene mapping information is included in the map file described above.
For example, you may apply clust to tens of human and mouse datasets generated by these different technologies / platforms:
| Platform / Format | Technology | Example identifier |
|---|---|---|
| Human RNA-seq reads (TPM) | RNA-seq | NM_000014.4 |
| Mouse RNA-seq reads (TPM) | RNA-seq | NM_001166382.1 |
| Affymetrix Human Genome U133+ 2.0 | Microarray | 1552258_at |
| Illumina Human WG-6 v3.0 | Microarray | ILMN_1825594 |
| Illumina Mouse WG-6 v2.0 | Microarray | ILMN_1243094 |
In this case, provide clust with a mapping file (TAB delimited) which looks like this:
| OG | H_RNAseq | M_RNAseq | H_U133+ | H_WG6 | M_WG6 |
|---|---|---|---|---|---|
| OG00001 | NM_001105537.2 | NM_001310668.1, NM_001310668.1 | 204474_at, 37586_at | ILMN_1676745 | ILMN_1236966 |
| ... | ... | ... | ... | ... | ... |
Here, the probes/transcripts that represent the human gene ZNF142 or its mouse orthologue Znf142 from the five platforms are mapped to a single unique OrthoGroup (OG) identifier (OG00001).
This mapping file is provided to clust by the -m option:
clust data_path -m map_file [...]
These are many reasons that result in missing some genes from some datasets:
- Datasets are from multiple species and some genes do not exist in some species (see Figure 8 above for example)
- Older platforms of microarrays did not include probes for some genes
- Other reasons
Clust allows you to automatically discard genes that do not appear in all (or most) datasets by
using the -d option. This option specifies the minimum number of datasets in which a gene has to be present
for it to be included in the analysis.
For example, if you have 20 datasets, you can force clust to discard any gene that is not included at least in 17 datasets by:
clust data_path -d 17 [...]
By default in v1.7.0+, Clust filters out genes with flat expression
profiles (profiles with absolutely no change in expression) after
summarising replicates and normalisation. To switch this option off,
use the --no-fil-flat option.
Also, clust can automatically filter out genes with low expression values if you provide the three options
-fil-v, -fil-c, and -fil-d to clust:
clust data_path -fil-v value -fil-c conditions -fil-d datasets
This will discard any gene that does not have at least the value of value,
at least at conditions conditions, at least in datasets. This is applied before normalisation
but after summarising replicates and handling gene mapping across multiple species.
A tightness parameter -t controls how tight the clusters should be
(tighter and smaller clusters versus less tight and larger clusters).
This is a real positive number with the default value of 1.0. Values smaller than 1.0 (e.g. 0.5) produce less
tight clusters, while values larger than 1.0 (e.g. 2.0, 5.0, 10.0, ...) produce tighter clusters.
Try larger values of -t to obtain tighter clusters:
clust data_path -t tightness_level
| Parameter | Definition |
|---|---|
| data_directory | The path of the directory including all data files |
| - | - |
| -m <file> | Path of the map file |
| -r <file> | Path of the replicates file |
| -n <file or integer list> | Path of the normalisation file or a list of normalisation codes. See the Normalisation section above for details. |
| -o <directory> | Custom path of the output directory |
| - | - |
| -t <real number> | (Cluster tightness) versus (cluster size) weight: a real positive number, where 1.0 means equal weights, values smaller than 1.0 means larger and less tight clusters, and values larger than 1.0 produce smaller and tighter clusters (default: 1.0). |
| -q3s <real number> | Defines the threshold for outliers in terms of the number of Q3's (third quartiles). Smaller values lead to tighter clusters (default: 2.0). |
| - | - |
| -fil-v <real number> | Threshold of data values (e.g. gene expression). Any value lower than this will be set to 0.0. If a gene never exceeds this value at least in FILC conditions in at least FILD datasets, it is excluded from the analysis (default: -inf) |
| -fil-c <integer> | Minimum number of conditions in a dataset in which a gene should exceed the data value FILV at least in FILD datasets to be included in the analysis (default: 0) |
| -fil-d <integer> | Minimum number of datasets in which a gene should exceed the data value FILV at least in FILC conditions to be included in the analysis (default: 0) |
| --fil-abs | -fil-v is used as a threshold for the absolute values of expression. Useful when the data has positive and negative values (e.g. log-ratio 2-colour microarray data). (default: not used). |
| --fil-perc | -fil-v is a percentile of gene expression rather than an absolute expression value (e.g. -fil-v 25 sets the 25th percentile of all gene expression values as the threshold). (default: not used). |
| --fil-flat | Filter out genes with flat expression profiles (constant expression over all samples in all datasets). (default: used). |
| --no-fil-flat | Cancels the default --fil-flat option. |
| - | - |
| -d <integer> | Minimum number of datasets in which a gene has to be included for it to be considered in the clust analysis. If a gene is included only in fewer datasets than this, it will be excluded from the analysis (default: 1) |
| -cs <integer> | Smallest cluster size (default: 11) |
| -K <integer> [<integer> ...] | K values: refer to the publication for details (default: all values from 2 to 20 inclusively) |
| - | - |
| --no-optimisation | Skip the cluster optimisation step. Not recommended except to compare results before and after optimisation (default: optimisation is performed). |
| --deterministic | Use deterministic settings across the steps of clust. Recommended if one requires the same results to be obtained when clust is run multiple times with the same parameters. This is not expected to compensate the quality, and it might become a default setting in future releases. |
| - | - |
| -np <integer> | Number of parallel processes (default: 1) |
| -h, --help | show the help message and exit |
Example datasets are available in ExampleData/1_RawData. These are three datasets from two yeast species, two datasets from fission yeast, and one from budding yeast.
That directory contains the datasets' files in a Data sub-directory, and includes three other files specifying the replicates, the required normalisation, and the gene mapping across the datasets, i.e. orthologous genes across the two yeast species.
Run clust over this data by:
clust Data/ -r Replicates.txt -n Normalisation.txt -m MapIDs.txt
Or let clust automatically detect suitable normalisation by running (v1.7.0+):
clust Data/ -r Replicates.txt -m MapIDs.txt
You may like to specify a tightness level -t other than the default by adding:
... -t 5
You may also specify an output directory other than the default by adding:
... -o MyResultsDirectory/
Example datasets of datasets taken from one species, have no replicates, and already normalised are available in ExampleData/2_Preprocessed, or more specifically in the Data directory therein. These datasets require no pre-processing, so you can simply run this command over the directory "Data":
clust Data/
Find the results in the Results_[Date] directory that clust will have generated in your current working directory.
This runs clust with the default tightness -t value of 1.0.
You may like to make the generated clusters tighter by increase -t or less tight
by decreasing -t. For example, try -t = 5.0 or -t = 0.2 by:
clust Data/ -t 5clust Data/ -t 0.2
You may also like to save results in an output directory of your choice by using -o:
clust Data/ -t 5 -o MyResultsDirectory/
When publishing work that uses clust, please cite this pre-print:
- Basel Abu-Jamous and Steven Kelly (2018) Clust: automatic extraction of optimal co-expressed gene clusters from gene expression data.
bioRxiv221309; doi: https://doi.org/10.1101/221309.

