| Parameter | Name | Example |
|---|---|---|
| Free element of the equation | FreeEl | function(g) exp( - g ) |
| Kernel | Core | function(g, s) exp( - ( g - s ) ) |
| Count of steps in a grid | step | 100 |
| Interval start point | intstart | 0 |
| Interval end point | intend | 10 |
| X-axis limits | limits | c(0.2, 0.5) |
| Quadrature for finite sums | method | "rectangle" |
| Method for calculation | method_global | "sum" |
| Error for approximation | eps | 0.05 |
Supported quadrature formulas for finite sums:
- Trapezoidal
- Parabolic (Simpson's rule)
- Rectangle (right)
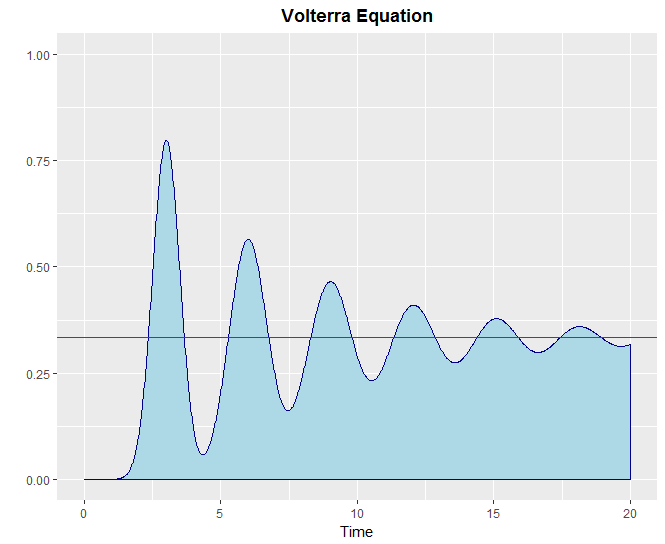
f <- function(g) dnorm(g, 3, 0.5)
v <- volt(
	FreeEl = f,
	Core = function(g, s) f(g-s),
	step = 1000,
	intend = 20,
	method = "rectangle"
)
v$plot = v$plot + geom_hline(yintercept = 1/3, color = "red")
print(v$plot)f <- function(g) dnorm(g, 3, 0.5)
v <- volt(
FreeEl = f,
Core = function(g, s) f(g-s),
step = 1000,
intend = 20,
method_global = "approx",
eps = 0.07
)
v$plot = v$plot + geom_hline(yintercept = 1/3, color = "red")
print(v$plot)Plot:
- Fix error definition in finite sums
- Time tracker