- Utilizing NVIDIA Data Center GPU Manager (DCGM), suite of tools for managing and monitoring NVIDIA datacenter GPUs in cluster environments.
- Has a dashboard which the customer can track the history of usages, and set alerts such as when GPU utilization suddenly increases or drops.
- All tools that are utilized are open sourced.

- DCGM Exporter: It exposes GPU metrics exporter for Prometheus leveraging NVIDIA DCGM. Running on each GPU machine under docker container. Lightweight.
- Prometheus: monitoring system with a dimensional data model, flexible query language, efficient time series database and modern alerting approach.
- Grafana Dashboard: platform for monitoring and observability
- Prometheus and Grafana running under a Kubernetes cluster on a separate CPU node within the same Private Network.
- Kubernetes running on k3s.
- You will need a CORE Paperspace Account that has permission to create A4000X4 and C5 droplets.
- A local environment where you can run Terraform.
The tutorial begins now. Please follow each steps sequentially.
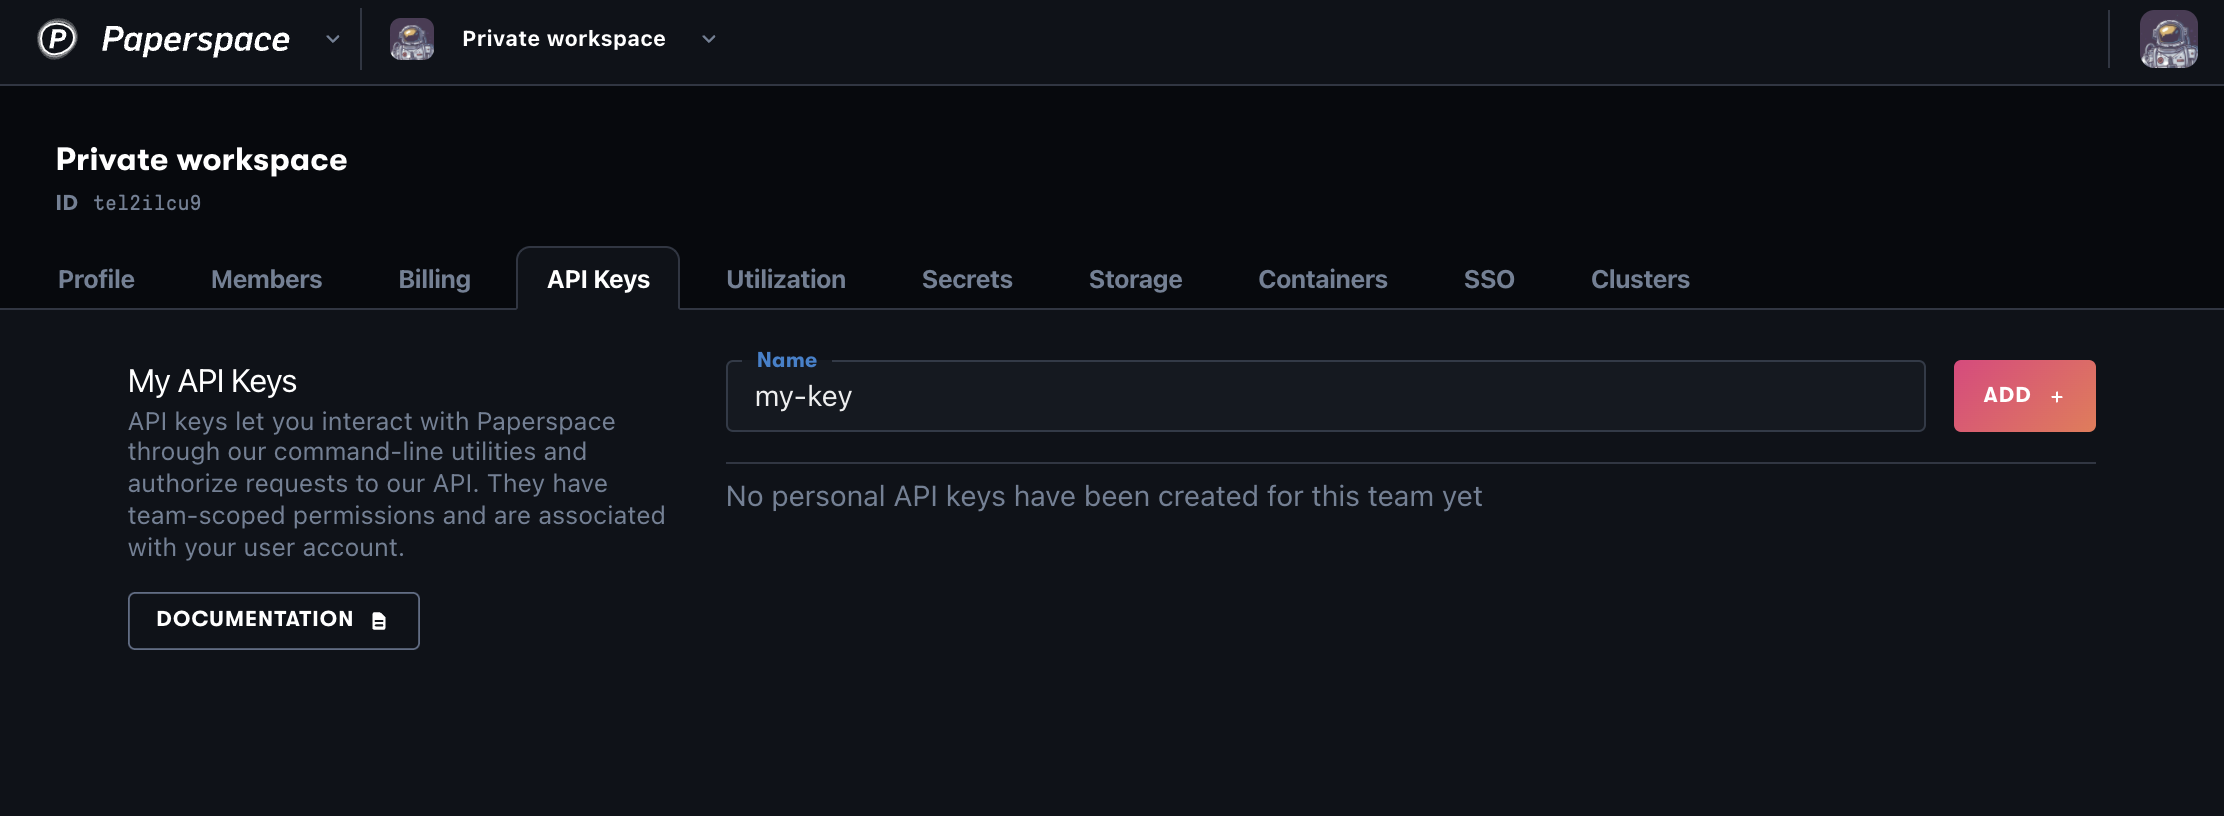
Obtain your API Keys for your CORE Paperspace Account by following the instructions at https://docs.digitalocean.com/reference/paperspace/api-keys/.
- Edit line 12 of the main.tf file with the API keys you just obtained.
- Edit line 20 with the email address of a user on your paperspace team
- Edit line 21 with the team ID of your Private workspace. You may find the team ID under the Priate workspace located at the top left hand corner as per https://docs.digitalocean.com/screenshots/paperspace/security-api-key.1ddd0cf5792ee166808e1b64e8725b78d6dbe3148d45b92fc8a0470bc06c099e.png under the Team Settings of the profile icon.
- Edit line 49 with the network ID of your Private network within the Private workspace. If you don't have a private network or do not wish to use an existing private network work, manually create one by following https://docs.digitalocean.com/products/paperspace/machines/how-to/create-private-networks/.
- Following the official instruction from Terraform website to install Terraform: https://developer.hashicorp.com/terraform/install
- Go to your home directory (e.g. cd /home/)
mkdir A4000cd A0000- Place the main.tf file that you just edited above in this directory.
terraform initterraform plan, to double check and ensure that it passes with the values configured in the main.tf (it should be 2 to add, 0 to change, 0 to destroy)terraform apply, then enter "yes"- Wait for a few minutes until it finishes, then go to the Paperspace Console to ensure that A4000x4 machine is created.
- Go to your home directory (e.g. cd /home/)
mkdir C5cd C5- Copy the main.tf from A4000 directory
- Edit line 16 to change it to "tkni3aa4", this changes the OS to Ubuntu 20.04 Server
- Edit line 39 to change the name to "C5 Machine"
- Edit line 40 to change it to "C5"
terraform initterraform plan, to double check and ensure that it passes with the values configured in the main.tf (it should be 2 to add, 0 to change, 0 to destroy)terraform apply, then enter "yes"- Wait for a few minutes until it finishes, then go to the Paperspace Console to ensure that C5 machines is created.
- ssh into your A4000 machine
sudo su- Run the DCGM Exporter Docker command:
docker run -d --gpus all --rm -p 9400:9400 -c 300 nvcr.io/nvidia/k8s/dcgm-exporter:3.3.6-3.4.2-ubuntu22.04 - The above container will output the promethesus metrics to localhost:9400 every 300ms. Run
curl http:https://localhost:9400/metricsand you should see a bunch of metrics in Prometheus formatting. - Downlaod installgb.sh and run
chmod +x installgb.shand then run./installgb.sh. This script will install the GPU Burn Container for later use. - Run
hostname -I | cut -d" " -f 1and grab the IP address to use in the next steps (on C5 machine, naming it as )
- ssh into your C5 machine
- Download the install.sh script and run
chmod +x install.shand then run./install.sh. This script performs the following:- Install k3s
- Install Helm Chart and update the helm charts
- Download the override.yaml script
- Edit line 11 of the override.yaml to change it to
<IP>:9400, where is obtained from the last step on the A4000 machine. - Download installpg.sh script and place it within the same directory as override.yaml
- Run
chmod +x installpg.shand runsource ./installpg.sh. This script performs the following:- Install prometheus
- Install grafana
- Configure nodeport for prometheus and grafana
- Run
kubectl get svc -o json | jq '.items[] | select(.metadata.name == "prometheus-server-ext" or .metadata.name == "grafana-ext") | { name: .metadata.name, nodePort: .spec.ports[].nodePort }'to output the port for gradana and prometheus dashboards. The dashboards are accessible throughhttp:https://<public_ip>:<port>, where<public_ip>is the Public IP for the C5 Machine, and<port>is the output of the port. - Run
hostname -I | cut -d" " -f 1and grab the IP address for later use (naming it as ). - Run
kubectl get secret --namespace default grafana -o jsonpath="{.data.admin-password}" | base64 --decode ; echoto obtain the Grafana password
- Access Prometheus that is running on the C5 machine through
http:https://<public_ip>:<port>for the prometheus-server-ext - Go to
http:https://<public_ip>:<port>/targetsand ensure that dcgm endpoint has StateUP. If the state is not up, double check the override.yaml part and if the DCGM exporter is running.
- Access Grafana that is running on the C5 machine through
http:https://<public_ip>:<port>for the grafana-ext - Go to
http:https://<public_ip>:<port>and login using the following credentials:- username: admin
- password was obtained from the last step on the C5 maine
- Go to Connections -> Data sources -> Add data source -> Select Time Series Database
Prometheus-> Within the Connection field, Edit the Prometheus server URL tohttp:https://<IP2>:<port>-> scroll down to the bottom and clickSave & test - Go to Dashboards -> Create Dashboard -> Import Dashboard -> Use the ID
12239-> Load -> Select the Prometheus datasource that was just created -> Import - ssh into your A4000 machine, Run
sudo suand then rundocker run --rm --gpus all gpu_burn - Wait for 5 minutes, then go back to the Grafana Dashboards, you should see GPU Utilization, Temperature all jumped for a small period of time.
- Destroy the A4000 machine by cd into A4000 directory and run
terraform destroy - Destroy the C5 machine by cs into C5 directory and run
terraform destroy
- The A4000 and C5 machines, if spinned up with the Terraform script as indicated, will shut down in 42 hours. But the machines won't be deactivated unless you destory them.
- Please file a GitHub Issue for any questions or comments.
- Please note that this tutorial is only used for demoing purposes and further configuration and refinement is required for production usage.