EctoQueryExplorer is a tool used to collect and analyze data produced by Ecto query telemetry.
Warning
EctoQueryExplorer is in its experimental stage. Use it at your own risk.
We've already identified a slow query and now want to be able to:
- locate code that produced a slow database query,
- run EXPLAIN for the query in question,
- do 1 and 2 very fast.
We also want to be better understand a bigger picture: which code produces which queries, how often, how much time time it takes for those queries to finish.
EctoQueryExplorer relies on query telemetry emitted by Ecto, specifically on stacktraces included in telemetry. Stacktraces were added to telemetry in elixir-ecto/ecto#3798.
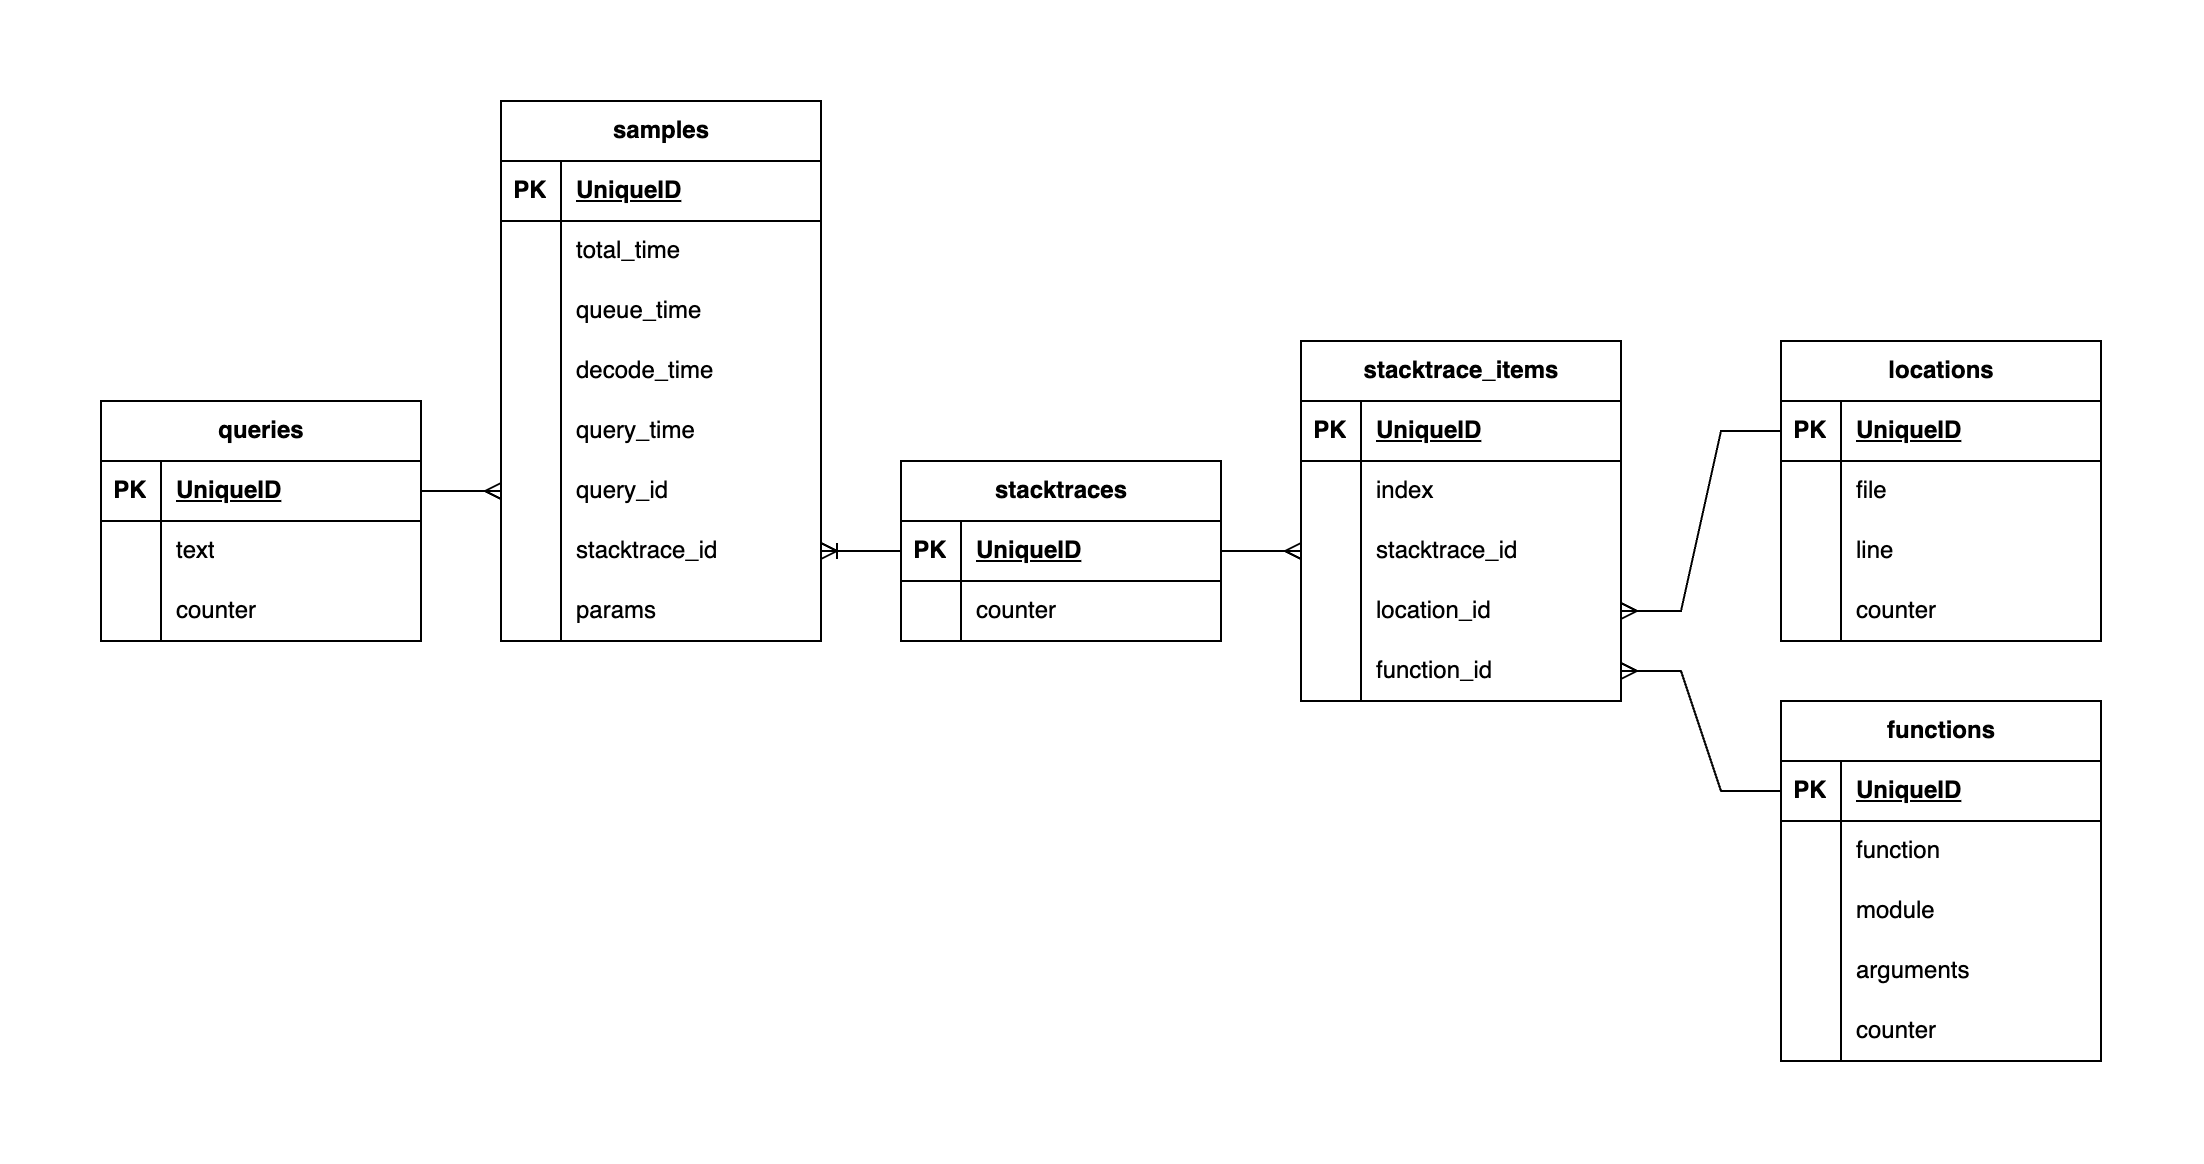
EctoQueryExplorer uses an ETS table to collect samples, queries, params, code locations and MFAs. Then EctoQueryExplorer saves collected data to SQLite3 to run analysis on top of.
SQLite3 schema looks like this: 
- EctoQueryExplorer will not attempt to persist data across application restarts,
- subsequent dumping of data from ETS to SQLite3 database will override any existing data in SQLite3,
- usage in clustered environments have not been tested,
- the Readme file you're looking at is the only documentation right now,
- only PostgreSQL target repositories have been tested at this time.
Installation boils down do installing ecto_query_explorer and configuring a new repository
to store the data.
Perform the following steps:
-
include the following line to
depslist inmix.exs:{:ecto_query_explorer, "~> 0.1"}
-
add a new repository module:
defmodule MyApp.EctoQueryExplorerRepo do
  use Ecto.Repo,
    otp_app: :my_app,
    adapter: Ecto.Adapters.SQLite3
end
-
update
config/config.exs:# add EctoQueryExplorerRepo to the list of repositories config :my_app, ecto_repos: [ MyApp.MyRepo, # ...existing repositories MyApp.EctoQueryExplorerRepo ] # add "stacktraces: true" option to all repositories you wish to collect telemetry from config :my_app, MyApp.MyRepo, stacktrace: true # configure EctoQueryExplorerRepo config :my_app, MyApp.EctoQueryExplorerRepo, database: "/tmp/ecto-query-explorer-#{config_env()}.sqlite3" # configure ecto_query_explorer config :ecto_query_explorer, otp_app: :my_app, repo: MyApp.EctoQueryExplorerRepo, ets_table_name: :ets_query_explorer_data, samples_to_keep: 5, source_ecto_repos: [ MyApp.MyRepo ]
-
update
application.ex, include repository and library setup:# ... children = [ # ...existing processes EctoQueryExplorer, MyApp.EctoQueryExplorerRepo ]
-
create a database migration with the following contents:
# priv/ecto_query_explorer_repo/migrations/1_initial.exs
defmodule EctoQueryExplorer.Repo.Migrations.Initial do
  use Ecto.Migration

  def up do
    EctoQueryExplorer.Migration0.up()
  end

  def down do
    EctoQueryExplorer.Migration0.down()
  end
end
-
run migration:
mix ecto.create --repo MyApp.EctoQueryExplorerRepo + migrate --repo MyApp.EctoQueryExplorerRepo
Start your application, and keep it running to collect some query data. After a while, call:
EctoQueryExplorer.Data.dump2sqlite()If you'd like to store and analyse queries emitted by the test suite after it finishes, add the following
code to test_helper.exs:
ExUnit.after_suite(fn _args ->
  EctoQueryExplorer.Data.dump2sqlite()
end)
After the SQLite3 database file is generated, you may use the library in 3 different ways.
The following convenience functions are provided by EctoQueryExplorer:
-
EctoQueryExplorer.Queries.filter_by_query/1- accepts a string containing a regular expression and returns a query with samples, including location data.See "The LIKE, GLOB, REGEXP, MATCH, and extract operators" for more details about the regular expressions.
Example:
EctoQueryExplorer.Queries.filter_by_query("update%")
-
EctoQueryExplorer.Queries.filter_by_parameter/1- use this one if you're looking for a query that was executing with a specific parameter value,Example:
user_id = "da06de53-34bb-4b6a-9f36-0e8478b05458"
EctoQueryExplorer.Queries.filter_by_parameter(user_id)
Notes:
- for a given query, parameters are saved only for 3 slowest samples,
- when calling this function, all stored parameters will fetched from the SQLite3 table and decoded using
:erlang.binary_to_term/1function.
-
EctoQueryExplorer.Queries.filter_by_mfa/3- return all queries, which were produced by stacktraces that contain given module, function and arity.Example:
EctoQueryExplorer.Queries.filter_by_mfa(User, :register, 1)
-
EctoQueryExplorer.Queries.filter_by_location/2- return all queries, which were produced by stacktraces that contain given file and line number.Example:
EctoQueryExplorer.Queries.filter_by_location("lib/my_app/path/to/code/module.ex", 12)
-
EctoQueryExplorer.Queries.explain/1- accepts query ID, and returns a map containing query plan. Can be used to produce JSON for tools like https://explain.dalibo.com.Example:
report = EctoQueryExplorer.Queries.explain(123_234_345)
Jason.encode!(report) # JSON to be used for further analysis or plan visualisation
Notes:
- the query will be wrapped in a transaction, which is reverted after producing the
explainreport. - query the database using familiar Ecto queries. Examples:
- query the file directly using
sqlite3command line utility. Examples:
- the query will be wrapped in a transaction, which is reverted after producing the
-
EctoQueryExplorer.Queries.top_queries/1- accepts a number, returns a list of most popular queries ordered by count
Consider running the query using .mode table and .width auto for nicer outputs. Run queries like this:
sqlite3 -cmd ".mode table" -cmd ".width auto 160" /tmp/ecto-query-explorer-prod.sqlite3 'query string'Here are some examples:
-
get top 5 most popular queries:
select id, counter from queries order by counter desc limit 15
-
get top 5 most popular queries, with snippet:
select id, counter, REPLACE(SUBSTR(q.text, 1, 150), char(10), \' \') snippet from queries q order by counter desc limit 10
-
get top 5 most popular stacktraces:
select id from stacktraces order by counter desc limit 5
-
get stacktrace with function names and line numbers:
  select f.module || '.' || f.function || '/' || f.arity as mfa,
         l.file || ':' || l.line as location
    from stacktrace_entries se
    join functions f on f.id = se.function_id
    join locations l on l.id = se.location_id
   where se.stacktrace_id = 86249873
order by se."index"'
-
find all queries that have at least 25 parameters in them:
select id, text from queries where text like '%$25%' order by counter desc limit 5
-
Profiling handle_event function:
mix profile.cprof profiling-handle-event.exs --callers --details
-
Generating a flamegraph:
Run
mix run flamegraph-handle-event.exs, then use https://www.speedscope.app to view the resulting file
EctoQueryExplorer is licensed under MIT license. See LICENSE for more details.