Skip to content

Different ways of object detection visualizations, given bounding box location

License

Notifications You must be signed in to change notification settings

gazeai/bbox-visualizer


Folders and files

NameName
Last commit message
Last commit date

Latest commit


History

12 Commits


Repository files navigation

Bbox-Visualizer

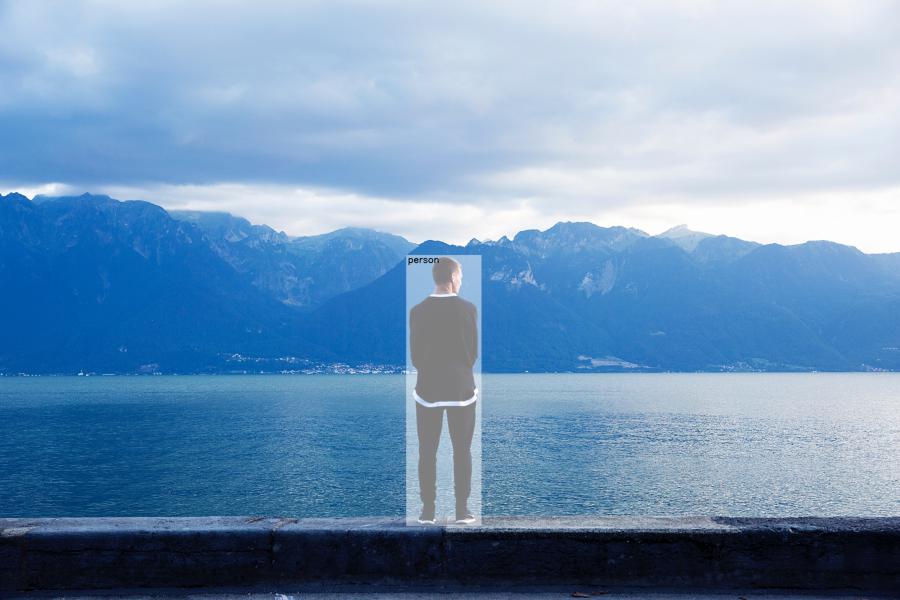
This is a simple script which has different functions that lets users draw different types of visualizations. Useful for instances when visualizing objects after object detection.

Photo by Joshua Earle on Unsplash

image function
bbox with label on top draw_rectangle(img, bbox, ...)
add_label_to_rectangle(img, label, bbox, top=True, ...)
bbox with label inside draw_rectangle(img, bbox, ...)
add_label_to_rectangle(img, label, bbox, top=False, ...)
bbox with T label draw_rectangle(img, bbox, ...)
add_T_label_to_rectangle(img, label, bbox, ...)
label with flag draw_flag_with_label(img, label, bbox)
label with opaque overlay draw_rectangle(image, bbox, is_opaque=True, ...)
add_label_to_rectangle(img, label, bbox, draw_bg=False, top=False, ...)

There are optional functions that can draw multiple bounding boxes and/or write multiple labels on the same image, but it is advisable to use the above functions in a loop in order to have full control over your visualizations. Nonetheless, the optional functions are as follows:

  • draw_rectangles(..., bboxes, ...)
  • add_labels_to_rectangles(..., labels, bboxes, ...)
  • add_T_labels_to_rectangles(..., labels, bboxes, ...)
  • draw_flags_with_labels(..., labels, bboxes, ...)

bboxes and labels are lists in the above examples.

About

Different ways of object detection visualizations, given bounding box location

Resources

License

Stars

Watchers

Forks

Releases

No releases published

Packages

No packages published

Languages

  • Python 100.0%