Tld;r trace is a tool that helps managers be more productive by providing more information about what their employees are actually doing and working on throughout the week. Trace provides more visibility on reporting and accounting for employees time so managers waste less time collecting, sorting, and finding information about their employees (what they worked on, where they're blocked, who they're interfacing with) and more time doing what they do best.
Trace hooks up and triangulates data from external data sources (starting with Slack) onto your ticketing platform (starting with Linear) so that instead of information about tickets and all your Slack thread/discussions living in separate domains (with no tie in between them), they're connected, allowing us to produce graphs, summaries, and query with natural language the most up-to-date information on what employees are working on. In short, we take all of the conversations about what is being worked on in Slack by your team and employees, summarize & index it, then map it onto your Linear tickets so that we can help save time reporting the most up-to-date information on what your employees worked on throughout the week (see Demo for what this concretely looks like)
Ticketing platforms like Linear and Jira do not provide the full picture on what employees work on. Most companies do not keep their ticketing platforms up to date and most importantly, most if not all of the discussion around tickets is happening in other platforms and tools like Slack, Zoom, Google Calendar etc. This makes it difficult for managers to quickly figure out the most up-to-info about what they're employees are working on, which is cruical to be able to help them. Trace helps save managers' time by triangulating information around discussions happening in Slack onto Linear and providing that information in different views to allow them to get a more granular, up-to-date, and informative picture on what they're employees are working on.
- Managers navigate to the home page where they will be greeted with a list of their employees, they can click on one to get more information
- An employee's dashboard currently consists of two graphs and a natural language query engine.
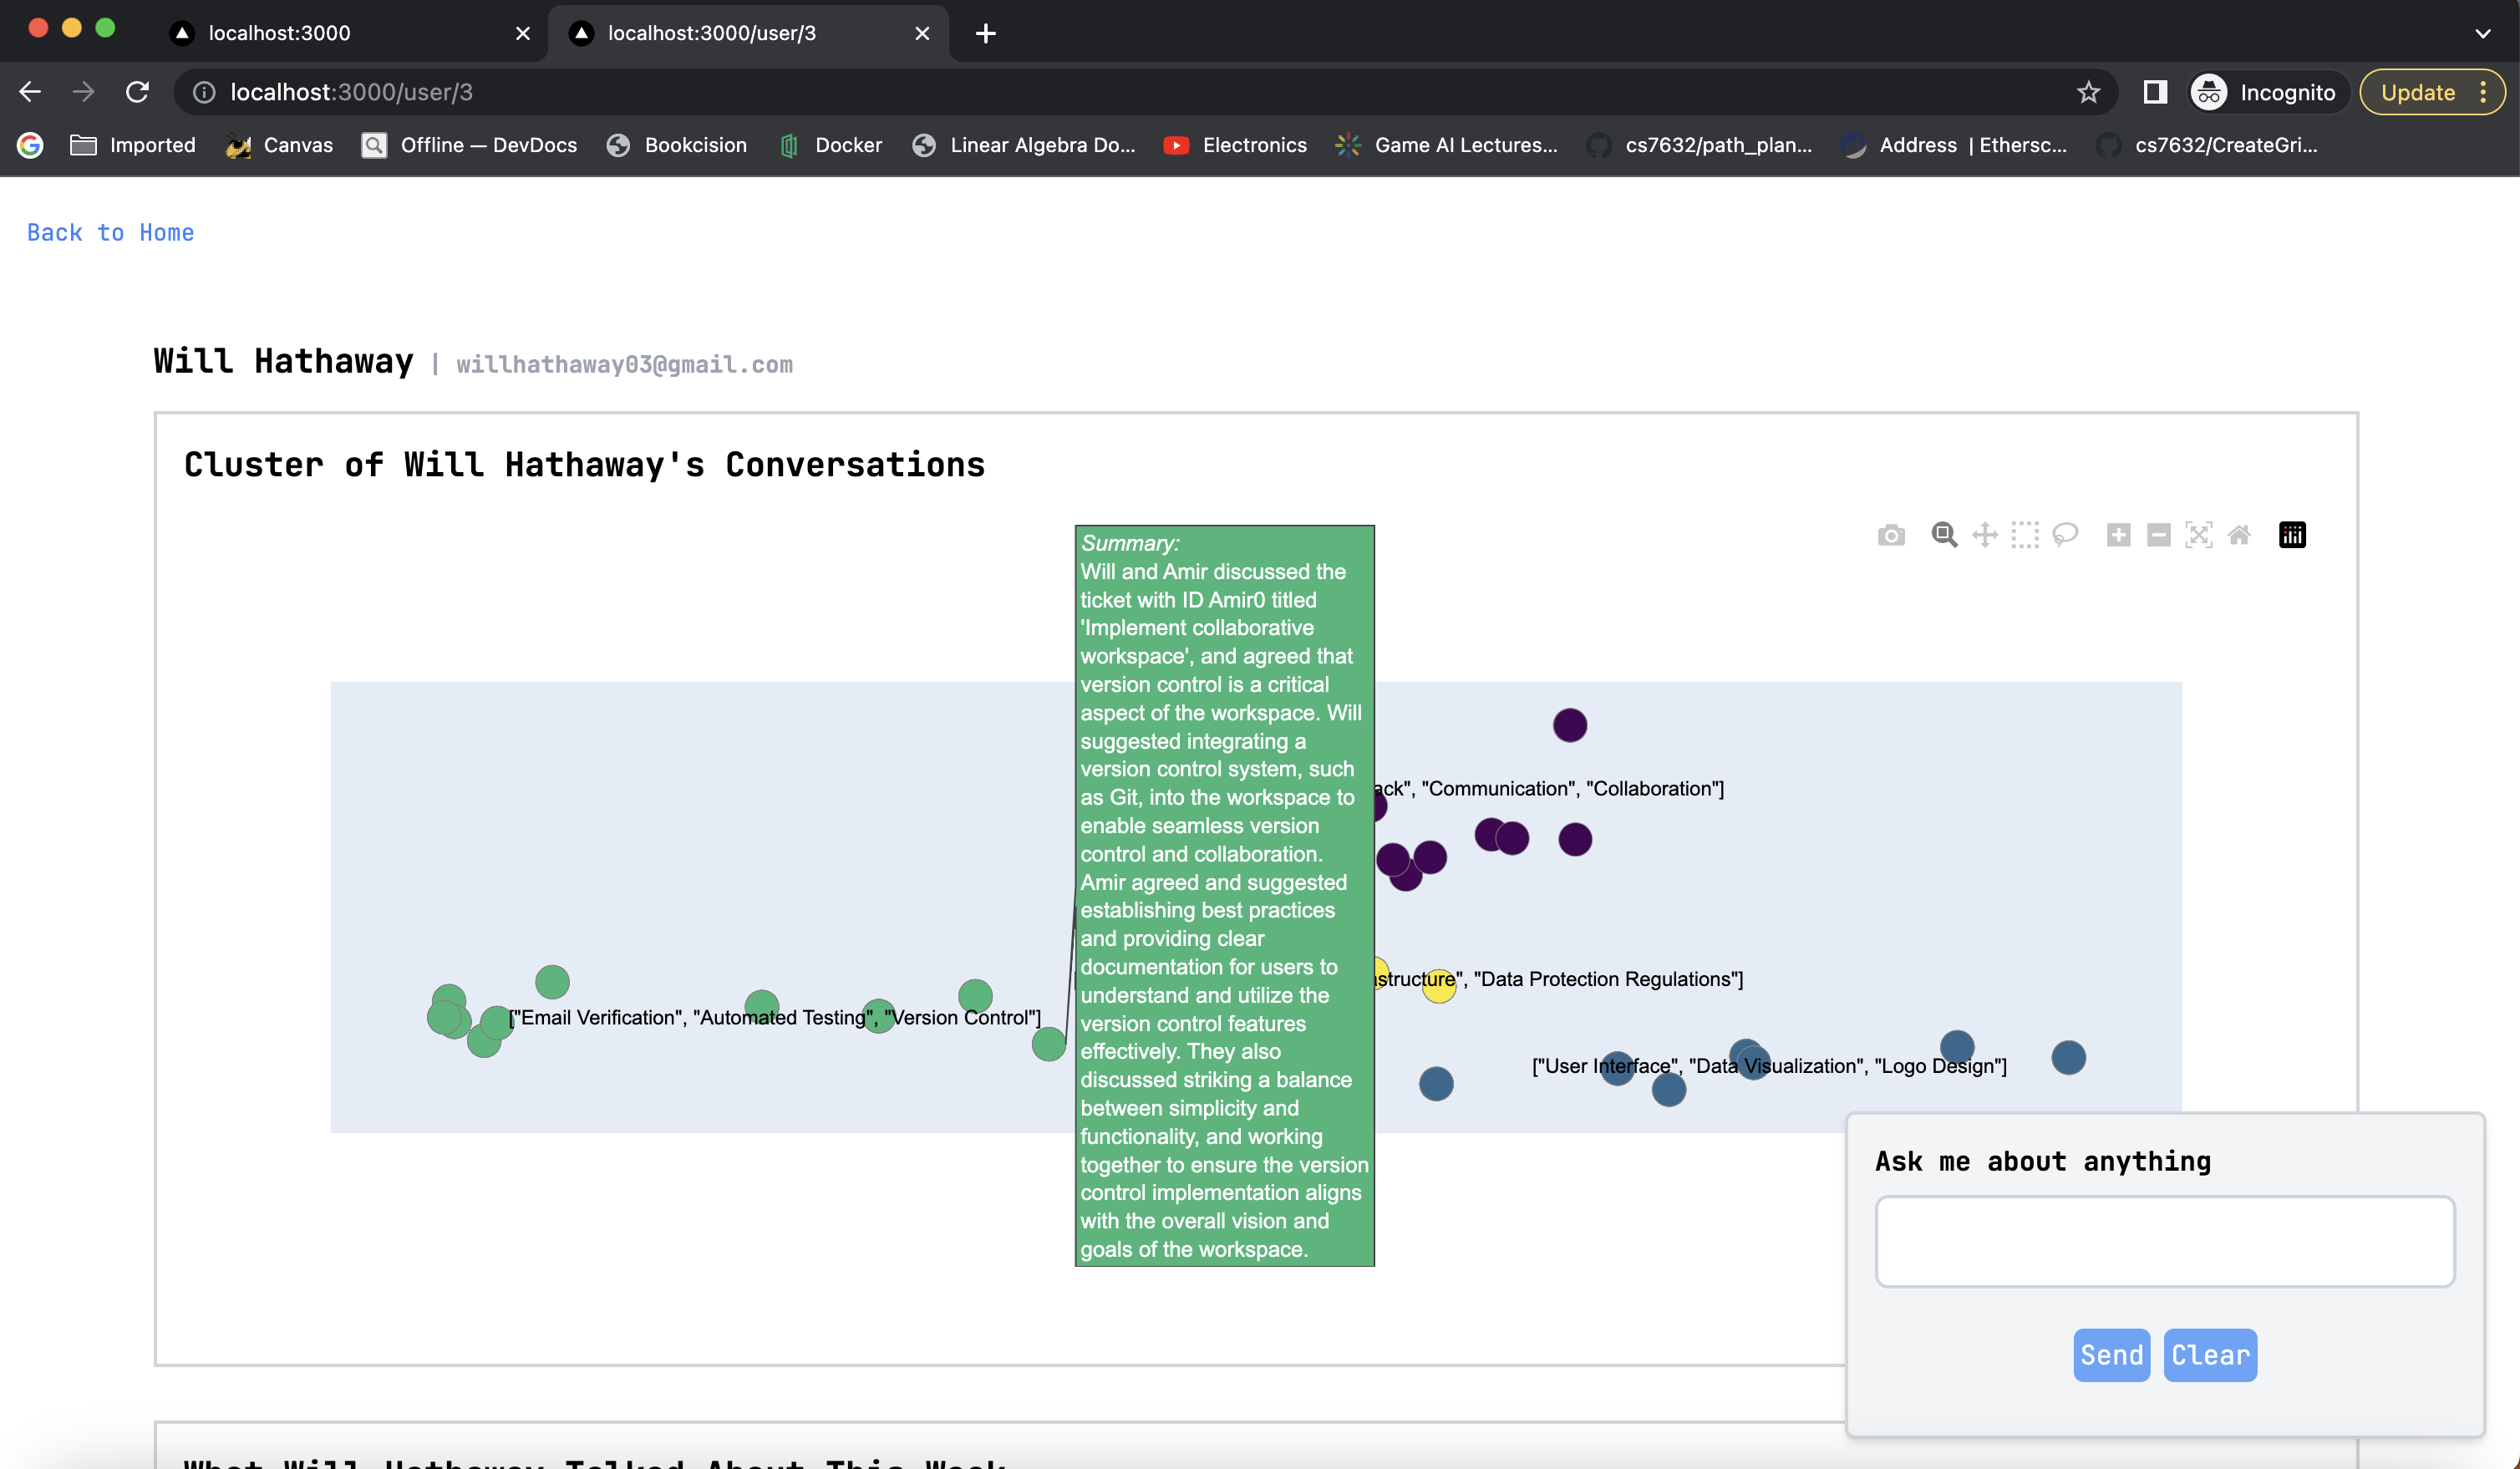
The first graph clusters and summarizes all of the employee's discussions occurring in Slack. You can see the clusters here are segmented by projects in the team's linear work space, so the manager can quickly get a sense on where Will spent most of his time this week.

Hovering over one of the dots will provide a summary of this particular discussion thread that the manager can quickly read to get a picture of this particular discussion. In our indexing pipeline, we treat one of these discussions or ProcessedMessages as a collection of messages around a particular topic. Concretely, this means one data point is a summary of all of the messages in one particular thread. For initial simplification, we assume that all messages around a particular topic occur in the thread.

For context, this is what our Slack setup looks like. Obviously, this is much cleaner that most Slack usage but we thought we would start there first for simplicity.

In addition to providing the summary, every circle or datapoint, when clicked on will navigate directly to the associated Slack thread for this particular discussion. This allows managers to quickly get more information about a particular discussion thread if they would like to.
The second graph Managers have access to is a time-view of when and what disucssions their employee worked on for the week. The Y-axis displays all of our projects according to our Linear workspace (which for simplicity since we used synthetic data are very high-level) and the x-axis display time. Every dot is as before one particular thread of discussion (called a trace). Managers can hover over one of the traces to see the summary as before and click on it to directly link to the Slack thread.

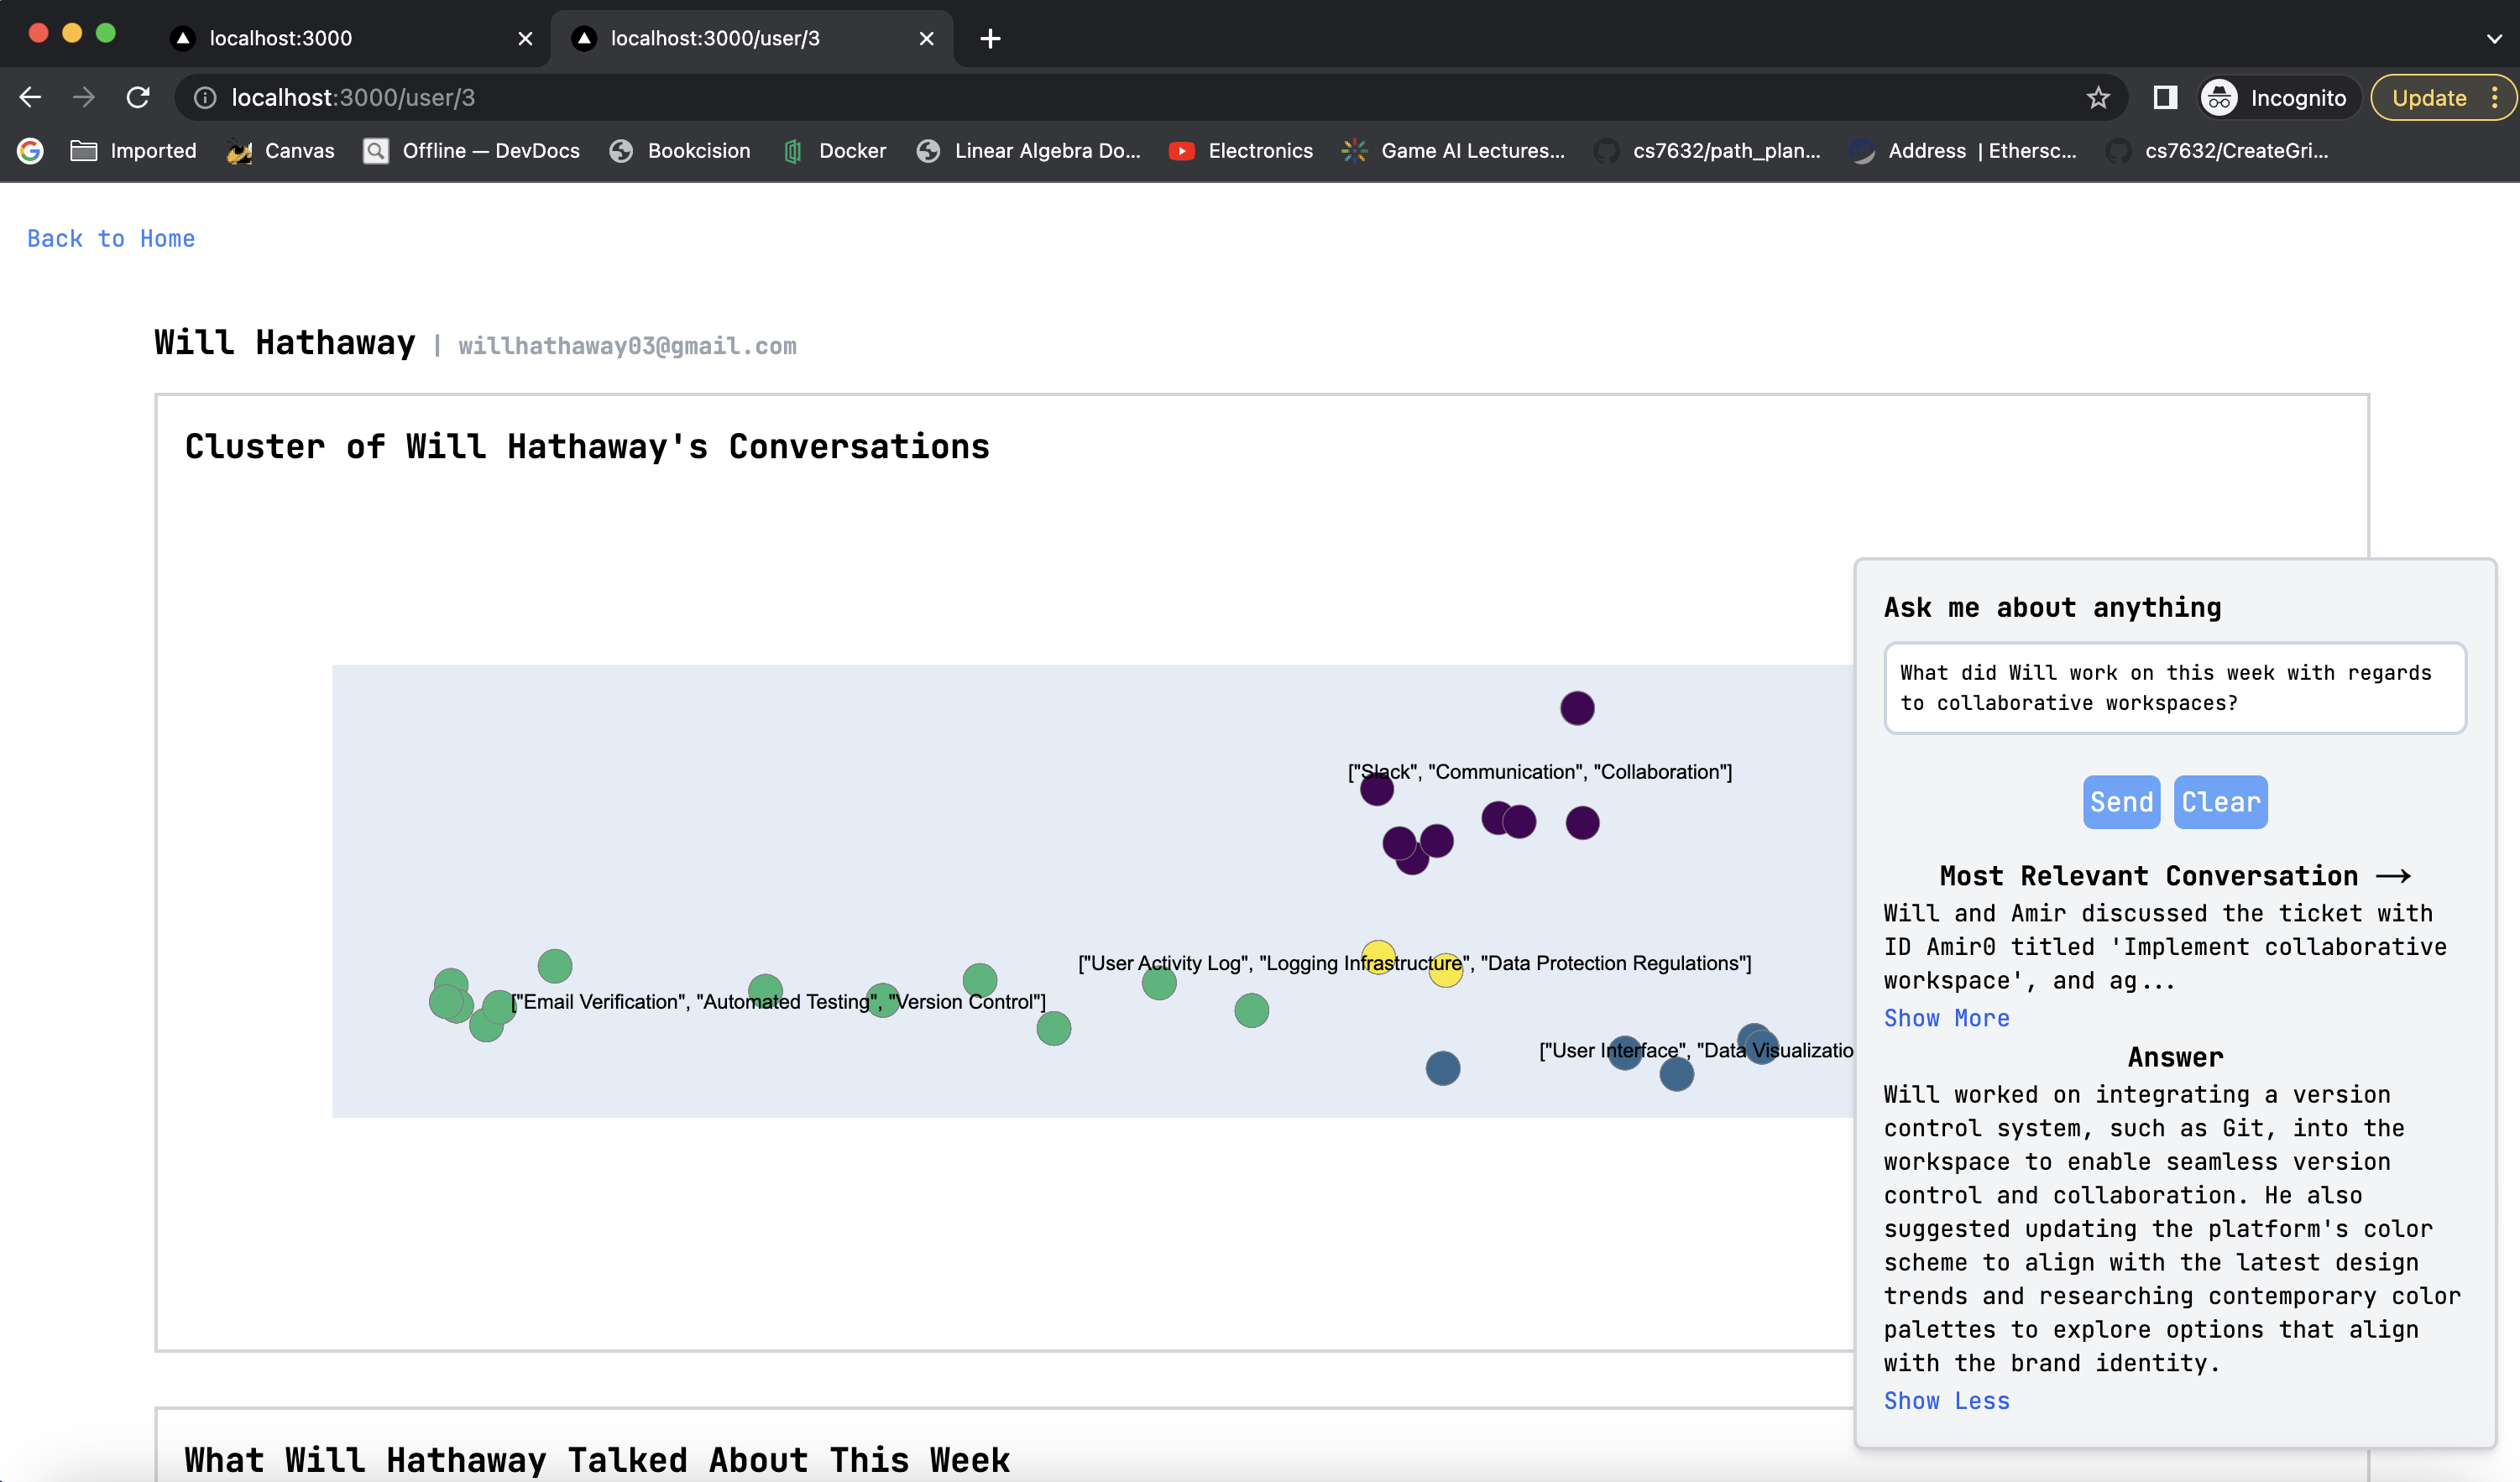
The final affordance to Managers is this chatbot view that allows them to quickly query specific questions about all of the employee's data.
For any question, Trace will attempt to answer it using the data as well as provide what it thinks is the most relevant discussion thread in Slack that a manager can quickly navigate to in order to get more information. Here's an example of it in action.


Right now, the entire repo is configured to hook into Linear and Slack with access tokens that you provide in the .env files. To get this running with your data
- Copy
.env.examplein theserverandfrontendfolders respectively into.envfiles and add your API keys for all of the keys.NEXT_PUBLIC_API_URLis just the route your server is running on (which would behttps://127.0.0.1:8000if you're running it locally). We use a hosted PostgresSQL database so make sure to add the URL from your provider of choice forDATABASE_URLin the server - Navigate into the
serverdirectly and runpoetry shellto activate the virtual environment. If you don't have poetry which is a package manager for Python, you'll need to install it. - Run the startup script by running
./run.sh. This should install the dependencies and start the server - Once the server is up and running, in a separate terminal shell, navigate into the
frontenddirectory and runnpm installfollowed bynpm run dev - Once the frontend and server are both running, the first thing you'll need to do is actually index all of your data. There is a route on the server that will do this at
/populate-allso you can runcurl https://127.0.0.1:8000/populate-allto start populating the data. Depending on how much data you have, this will take some time. For a Linear project with ~50 tickets, 4 projects, and a Slack workspace with ~200 messages, this usually took around 30 minutes. - Once that endpoint returns, the data should have populated, and you can navigate to
https://localhost:3000to view it
One of the main challenges we had in getting a simple prototype of this idea working is getting access to high quality data. Because we did not have a startup we could grab their data from, we had to spend a lot of time generating realistic synthetic data in Linear and Slack that we could use to test and visualize to see if this product was helpful. We think the screenshots and demo already show how this can be super helpful in this very small, constructed instance, the usefulness scales with the data, which is to say that any startup or business that actually uses these platforms would have way more Linear and Slack data, which would make the results very informative for managers.
- This currently only works with Slack and Linear, we did not have time to connect other data sources like Zoom, GSuite etc. to triangulate and report all of the information.
- We made some simplifying assumptions that are worth nothing
- how the data would structured (i.e. a discussion is all of the messages in a particular thread)
- for discussions we could not trianglage onto Linear tickets, we just categorize them as untracked, although we naturally don't have 100% accuracy so some discussions might be missed
- we do not do any intelligent post-processing on summarizing the discussion threads like discarding clearly useless messages (like
Joe joined the channel) or trying to connect discussions happening outside of threads
