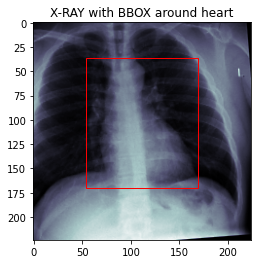
In this project we will preprocess the data for the cardiac detection task. Then, we will create a custom DataSet which will load and return an X-Ray image together with the location of the heart.
At first we download the data from kaggle (https://www.kaggle.com/c/rsna-pneumonia-detection-challenge/data)
Dataset: Wang X, Peng Y, Lu L, Lu Z, Bagheri M, Summers RM. ChestX-ray8: Hospital-scale Chest X-ray Database and Benchmarks on Weakly-Supervised Classification and Localization of Common Thorax Diseases. IEEE CVPR 2017, http:https://openaccess.thecvf.com/content_cvpr_2017/papers/Wang_ChestX-ray8_Hospital-Scale_Chest_CVPR_2017_paper.pdf
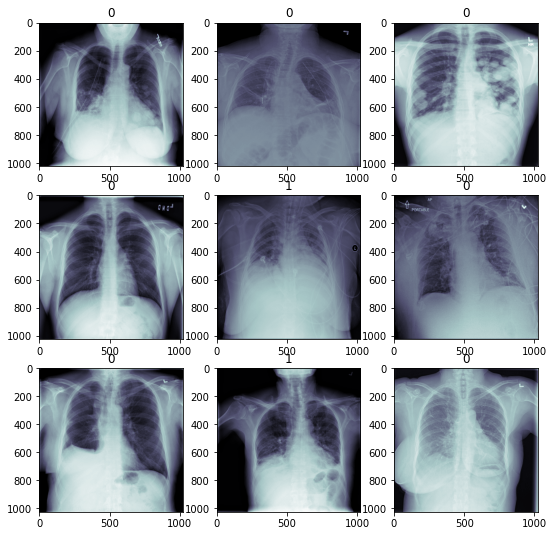
Some example images from dataset :

We provide bounding boxes for around 500 images of the RSNA pneumonia detection challenge dataset.
We will again convert the images to npy files for efficient storage and faster data loading.
In order to efficiently handle our data in the Dataloader, we convert the X-Ray images stored in the DICOM format to numpy arrays. Afterwards we compute the overall mean and standard deviation of the pixels of the whole dataset, for the purpose of normalization. We standardize all images by the maximum pixel value in the provided dataset, 255. All images are resized to 224x224. To compute dataset mean and standard deviation, we compute the sum of the pixel values as well as the sum of the squared pixel values for each subject. This allows to compute the overall mean and standard deviation without keeping the whole dataset in memory.
As most of the torchvision models, the original ResNet expects a three channel input in conv1.
However, our X-Ray image data has only one channel.
Thus we need to change the in_channel parameter from 3 to 1.
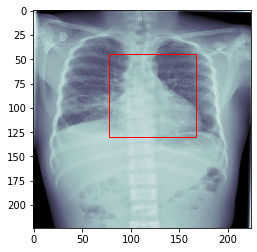
4 outputs: We need to estimate the location of the heart (xmin, ymin, xmax, ymax).
Loss function: We are going to use the L2 loss (Mean Squared Error), as we are dealing with continuous values.


