The Qlik Sense svgReader Extension is meant to provide the ability to visualize data on an image or map using color and shading, similar to a choropleth map. The extension itself is pre-packaged with 34+ maps of various countries and their different regions, as well as a world map and maps of Europe and Africa.
Also, there is the ability to load a custom SVG (such as a floorplan) and visualize data across its regions.
How It Works
An SVG image is basically an XML document which contains data telling the internet browser how to draw an image. The different shapes that the SVG draws can be separated out in the XML and thus manipulated and colored however necessary. This extension takes advantage of this technology by allowing the QVW to target and color the different shapes by identifying the ID of the SVG element.
For example, a map of US states will have a shape for the state of Pennsylvania. This state is represented in the SVG image as some code with an ID of "PA". By targeting this ID of "PA" the extension is able to then color this state.A very useful (and free) tool for identifying and manipulating SVG IDs is Inkscape. It can also be used to draw SVGs.
http:https://www.inkscape.org/en/
Once a map is chosen and loaded in the extension, the data in the QVF will need to somehow link to the region ID on the SVG. Typically the regions are identified by ISO code. The reason for this is because it is a globally standard code for identifying regions, and it eliminates the possibility for confusion over the naming, spelling, etc. of the different regions. Loading these ISO codes should be fairly easy, and the data can be scraped from sites like Wikipedia without much difficulty.
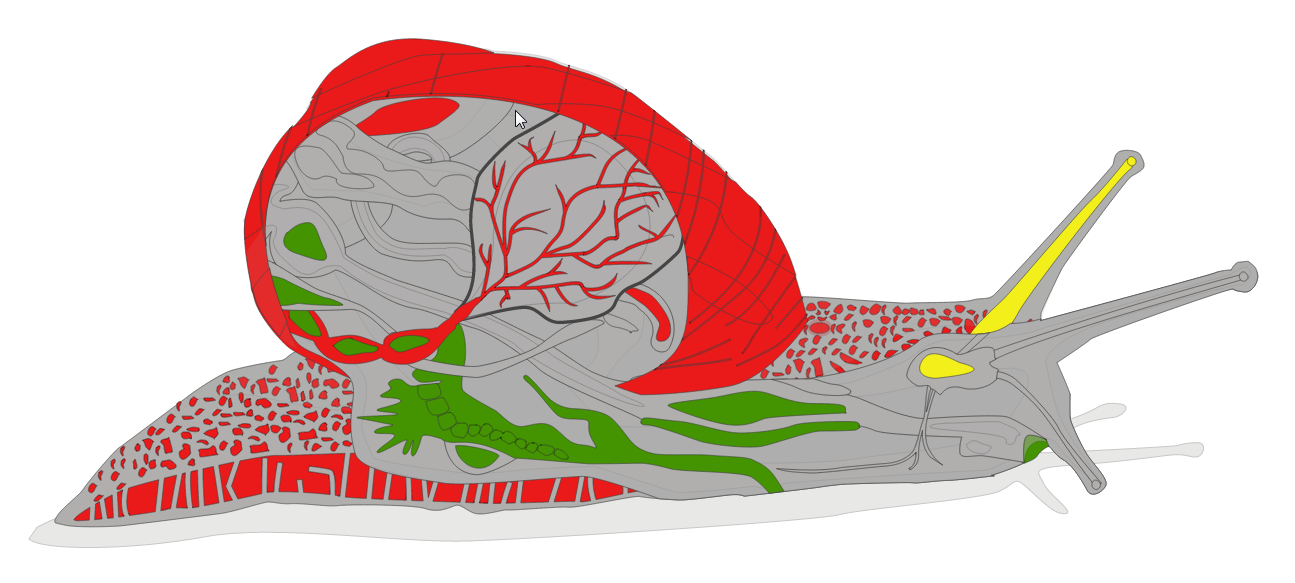
You can also create custom SVGs of just about anything, even a snail:
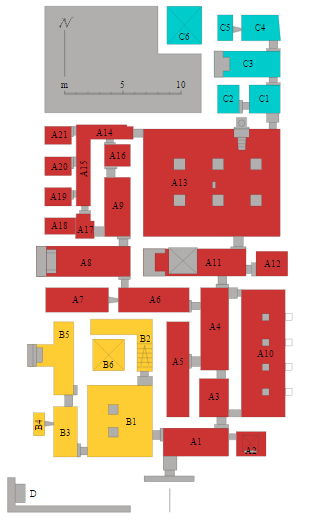
Or floorplan of an egyptian burial tomb:
You can now also set the custom SVG path using a Qlik Sense variable, which could allow for drilldowns, etc.
If you create your own custom SVG maps, please contribute them to Qlik Branch
Installation & Use
Dimensions The extension only needs one dimension. This dimension should match the ID of the svg elements. So if you're using the map of the 50 US states, this dimension should have the two character state abbreviation.
Measures The first measure is the value associated with the dimension. If there isn't a color dimension, this value will be used to shade the regions between two colors.
The second measure is the optional color measure. This can be used to manually set the regions to certain colors, for example, like a traffic light. Please see the snail and us counties examples. When a color measure is added, the hot, cold, and disabled properties will disappear.
Properties The properties are relatively straightforward. Please note that the color picker property is not supported and is an undocumented property in Qlik Sense.
Now an explanation of the properties:
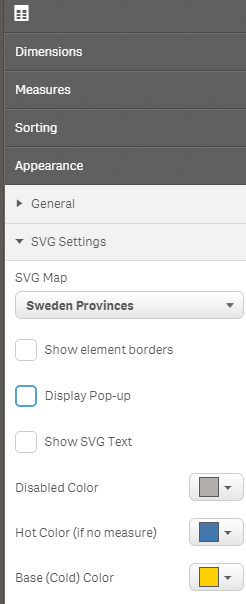
SVG Map is the list of built in SVG maps. If you want to load a custom SVG, select the custom SVG option.
Show element borders tells the extension whether or not to put borders around the SVG elements. Sometimes forcing borders around the elemts makes the extension more readable.
Display Pop-up controls whether or not to show a pop-up on mouse over. The pop-up will simply contain the dimension field and value.
Show SVG Text is an option whether to show text on the custom SVG or not.
Disabled Color sets the color of regions that are in the SVG but have no data associated to it.
Hot Color sets the color to use for the upper values.
Base (Cold) Color sets the base color to use for the lower values. This can be used to blend colors. Or if you simply want to shade one color, set this to white.
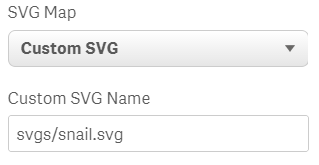
Custom SVG Name tells the extension where to find the custom SVG you want to load. This can also be set to an expression as long as it returns a valid SVG path.
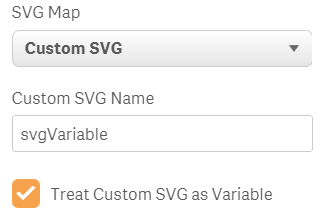
Treat Custom SVG as Variable tells the extension to look for a Qlik Sense variable specified in the Custom SVG text box.
Needed Improvements
This extension was in high demand so there are several things which could have been done to improve it. For example...
-
Reduce the number of loops the extension does across the SVG to improve performance.
-
Add the ability for the extension to zoom into the selected regions
-
Add a lasso tool
-
Make an option to not use the Qlik Sense UX selection model. One click = one selection
-
Make a more robust color picker
-
Have the extension repaint the SVG rather than emptying the extension and redrawing the whole thing
-
Add an option to generate a legend
-
Do the color expression without needing another expression to be added first