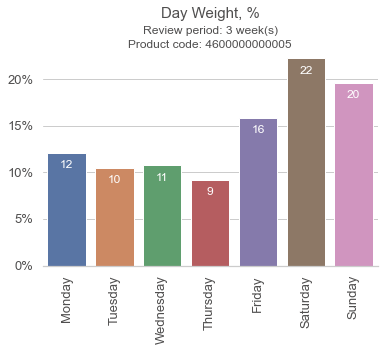
This code is meant to display the ratio of demand within a week. The point is that some products may have bigger demand on a specific weekday: for example, on Tuesdays. This information can be taken into account for replenishment planning. It will help specialists from supply planning or customer service departments to prepare for days with either low or high demand.
First part of code is taken from Service Level and Coverage KPIs script. Dataframe created with this script helps to build a bar chart for a specific product throughout a set number of weeks.
This bar chart can be helpful in at least 2 cases.
With VMI-driven replenishment this chart can help supply planners or customer service specialists to plan deliveries for retailers. Based on the chart they can decide that it's better not to deliver product above on Thursday (day with lowest sales). However, they need to prepare for Saturday - day with biggest sales. That's why, delivery by the end of Friday would be the best option.
If retailer deals with replenishment tasks on their own, they can also use this bar chart to track sales throughout the week and place orders with a more suitable delivery date.
In both cases such a data-driven replenishment can help responsible specialists to improve stock coverage.
