CC BY-NC-SA Eric Woo-Shem & Brian Woo-Shem


- Displays the current CO₂ level so you can quickly check if the current conditions are safe.
- Records CO₂ levels over time. Good for tracking regularly-scheduled events (eg. school & work).
- Accurate within ~60 ppm under typical conditions.
- Costs $60 to $110 - less than half the cost of commercial sensors.
- No soldering required! Just connect wires.
As society reopens amid the ongoing COVID-19 pandemic, preventing the spread of the virus is crucial to keeping doors open. Scientists and engineers studying aerosols at major research institutions have identified that good ventilation plays a major role in reducing contagion in addition to vaccines, regular testing, and masks [1]. Since COVID-19 spreads primarily through airborne virus particles, outdoor and well-ventilated areas are much safer because infectious particles blow away before they can be inhaled by a susceptible person. The challenge is identifying which spaces are poorly ventilated and could contain high concentrations of the virus.
Ideally, we would measure the concentration of COVID-19 virus particles in the air directly, however such a sensor does not exist. Instead, researchers identified carbon dioxide as a proxy measurement to determine if a space is well-ventilated, as doubling the CO₂ concentration doubles the risk of infection [2][3]. Humans exhale carbon dioxide at approximately 100 times the concentration of the ambient air. High CO₂ levels indicate inadequate ventilation so if a contagious person were present, virus particles remain in the air and there is a high risk that others in the space will get sick.
The typical outdoor air CO₂ levels are between 410-420 ppm in remote locations, and around 450 ppm in urban environments [4][16]. We exhale roughly 40000 ppm CO₂ [5]. Aerosol researchers recommend keeping CO₂ below 800 ppm to prevent the spread of COVID-19 [1][2][3][6]. Aside from the pandemic, elevated CO₂ levels make a room feel “stuffy” and can cause a decline in cognitive ability [7]. CO₂ sensing is used in Heating, Ventilation, and Air Conditioning (HVAC) control and energy-saving thermostats to detect when a room is occupied and only operate air conditioning or heating during those times [14][15]. This can save energy by not running equipment while a building is unoccupied, while ensuring that people in the building have clean, healthy air [14].
This is a frugal CO₂ sensor so most of the parts can be interchanged with similar ones. A detailed Bill of Materials with the exact components used in this version of the sensor is provided as "CO2_Sensor_Bill_of_Materials.xlsx". Different sheets show suggestions for products to purchase for the lowest cost for varying numbers of sensors. The quantities and exact cost autocompute if you plug in the number of sensors you want to build.
Note: Product suggestions in Bill of Materials are for convenience only. This project does not receive any incentive, financial or otherwise, for suggesting any particular product.
One sensor can be built for roughly $100, and 10 sensors for about $87 each if all parts are purchased new (As of August 2021).
| Part Description | QTY per Sensor |
|---|---|
| Arduino: Nano (recommended), Uno, Mega, etc. | 1 |
| SCD-30 NDIR CO2 Sensor | 1 |
| STEMMA QT Cable Headers for SCD-30 | 1 |
| Breadboard: Mini breadboards recommended, but any size can work | 1-2 |
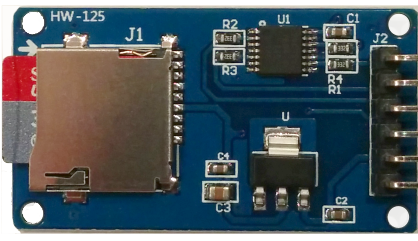
| Micro SD Card Adapter Module (Or SD Card Adapter Module) | 1 |
| Micro SD (or SD) Card. Small is fine - 1 GB is overkill | 1 |
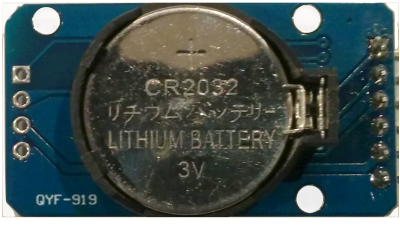
| DS3231 Real Time Clock Module | 1 |
| CR2032 Battery | 1 |
| Jumper wires, assorted | 10-20 |
| USB Power Bank Battery 5V: optional; 9V battery adapter or other power supplies work as well | 1 |
| 16x2 LCD Display: Optional; only needed if you want to display the current CO₂ levels | 1 |
| Small Box: Cardboard, 3D printed, etc. Just large enough to hold everything, and with holes for the CO₂ sensor intake and LCD screen if used | 1 |

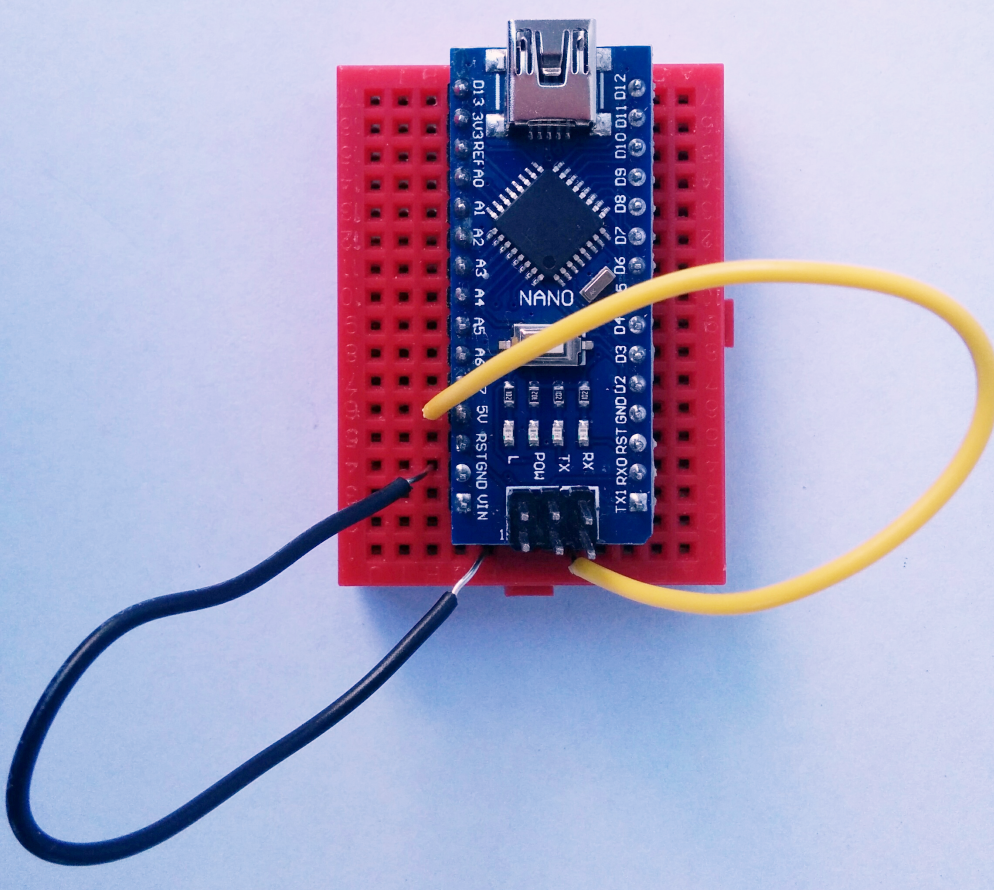
Complete connection diagram.
-
Insert the CR2032 battery into the RTC, and your memory card into your card reader.
-
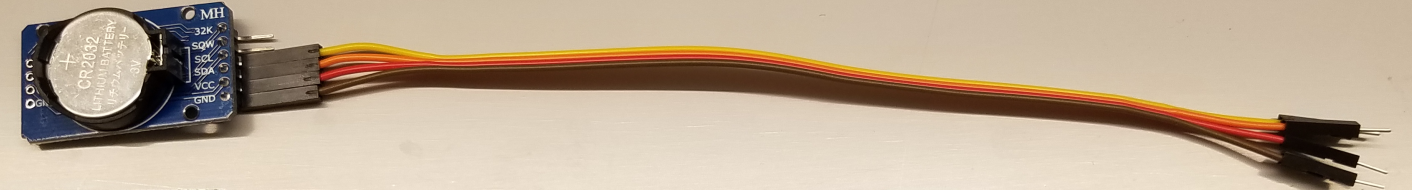
Attach 4 male-to-female wires onto the GND, VCC, SDA, and SCL ports on the RTC. If you have a new set of jumper wires, you may need to break them off of the bundle. Wire colors may vary.
-
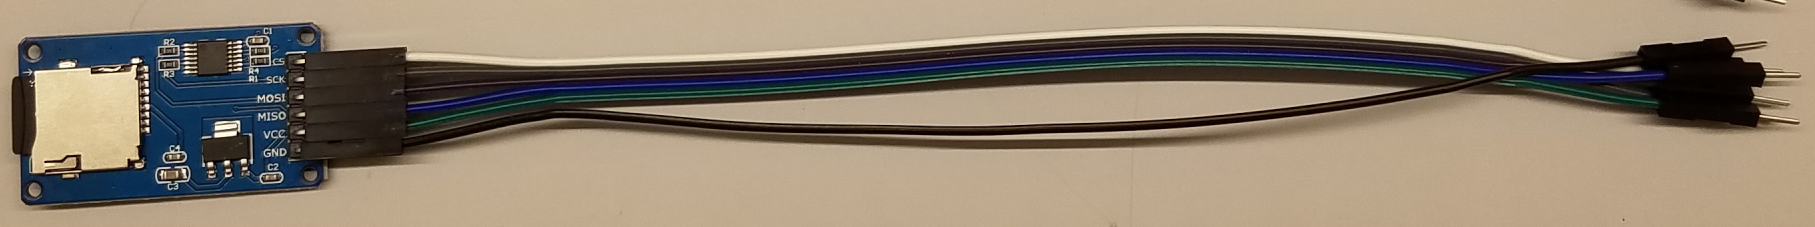
Attach 6 male-to-female wires for all 6 pins on the card reader.
-
(For Nano only) Place and push in the Arduino Nano into one of the breadboards, as shown.
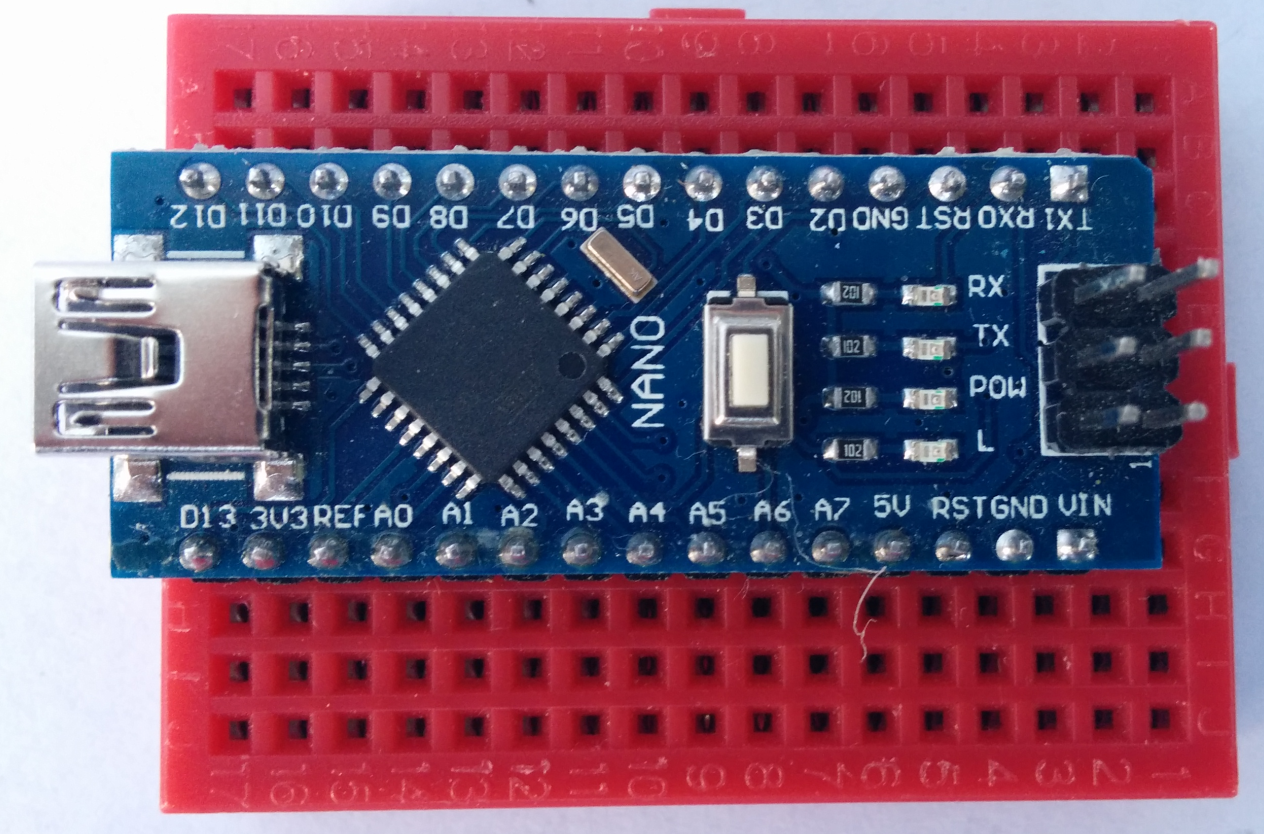
- (For Uno or Mega) The connectors are built in, so this step is not necessary. However, you may need to run a wire from a particular pin to a breadboard row if more than one connection is required.
-
Plug the SCD-30 cable headers into either port of the CO₂ sensor. Both ports are identical, but the plug has a correct orientation.
-
(If using display) Poke the LCD into a breadboard. Mini-breadboards: use a second breadboard. Note: you can also use male-to-female wires and connect to the LCD pins directly, but we found this to be more difficult.
-
Connect the Ground on the Arduino to an unused row on the breadboard. Connect the 5V on the Arduino to a different unused row. Below is an example for mini-breadboards.
-
Connect the Real Time Clock module wires:


| Sensor Wire | Breadboard Row |
|---|---|
| VCC | 5V row created in step 7 |
| GND | the ground row created in step 7 |
| SDA | Arduino pin A4 |
| SCL | Arduino pin A5 |

- Connect the SD Card Reader wires:
| Sensor Wire | Breadboard Row |
|---|---|
| GND | ground row created in step 7 |
| VCC | 5V row created in step 7 |
| MISO | Arduino pin D12 |
| MOSI | Arduino pin D11 |
| SCK | Arduino pin D13 |
| CS | Arduino pin D10 |

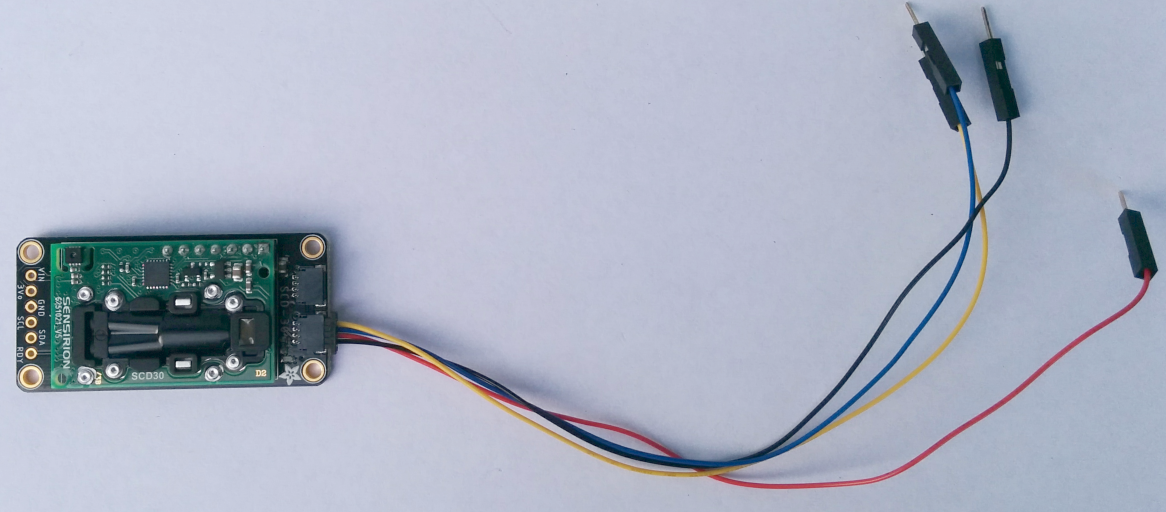
- Connect the SCD-30 Sensor wires:
| Sensor Wire | Breadboard Row |
|---|---|
| Black | ground row created in step 7 |
| Red | 5V row created in step 7 |
| Blue | Arduino pin A4 |
| Yellow | Arduino pin A5 |

- Connect the LCD Wires: Short wires cut to length are preferred because they are more robust and make the device more compact. If using mini-breadboards, connect the LCD breadboard to the digital pin side of the Arduino breadboard using the little clip. Long wires are no longer recommended because they tend to get snagged and fall out.
| LCD Pin Label | LCD Pin Position (Left to right) | Arduino Pin |
|---|---|---|
| VDD | 2 | 5V |
| V0 | 3 | D6 |
| RS | 4 | D9 |
| RW | 5 | Ground |
| E | 6 | D8 |
| D4 | 11 | D5 |
| D5 | 12 | D4 |
| D6 | 13 | D3 |
| D7 | 14 | D2 |
| A | 15 | D7 |
| K | 16 | Ground |

Congratulations! The sensor is fully assembled. Now connect the Arduino to your computer and upload the program to use it.

-
Connect the Arduino USB cable between the Arduino and your computer.
-
(If not already installed) Download ArduinoIDE.
-
Set the time on the RTC (if not already set): Download the code file Set_RTC_Time.ino and open it in ArduinoIDE.
-
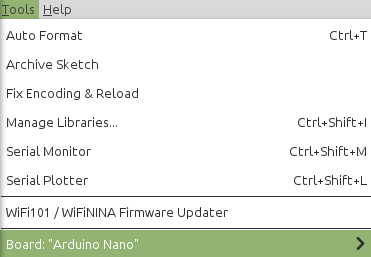
Go to Tools>Board and select your Arduino type.
-
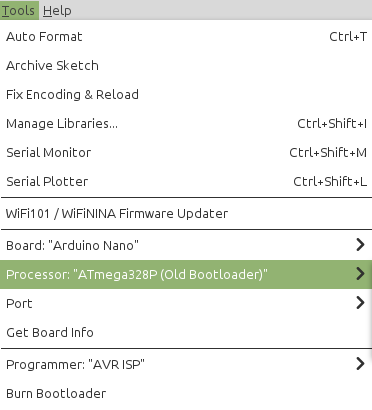
(Arduino Nano only) Go to Tools>Processor and select "ATmega328P (Old Bootloader)".
-
Go to Tools>Port, and select the one including the number “x”, equal to the port you plugged the Arduino into. If you are unsure which port, start with the first option and click “Get Board Info". If you get an error, it is the wrong one. Try the next port and repeat until one works. You can also try uploading the code on each port in step 20.
-
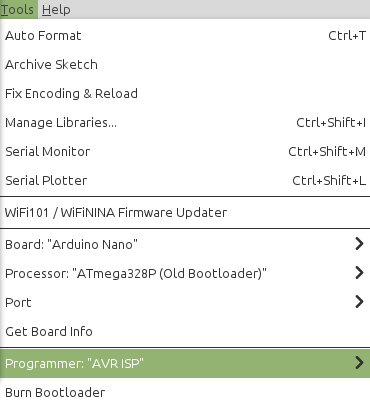
Go to Tools>Programmer, and select “AVR ISP”.
-
Install the necessary packages:
-
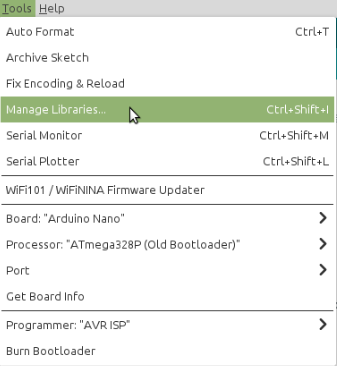
Go to Tools>Manage Libraries. This may take a minute to load.
-
Type "Adafruit_SCD30" into the search bar at the top and press enter. This may take a minute to load.
-
Look for the package named "Adafruit SCD30". If the package isn't already installed, press the "Install" button. You may need to install dependencies.
-
Repeat for RTClib (named "RTClib"). You may need to install "SD" and "LiquidCrystal", but those should be pre-installed.
-
-
In the RTC_Time_Set.ino code, go to line 19 with the code
rtc.adjust(DateTime(2021, 10, 13, 18, 17, 00));. Change the numbers to match the form '(Year, month, day, hour in 24 hour time, minute, second)' for the current date and time. The RTC module will be set to the time specified when you upload the code. Tip: If you want very precise time, set the minutes and seconds for about a minute out, then watch the clock and hit upload about 4-6 seconds before the time you set. However, within ~5 minutes is usually good enough.- Alternative method: A different code from Arduino Get Started can automatically set the RTC to the time on your computer; follow the instructions at that link to set the RTC.
-
Upload the program to the Arduino by clicking on the right arrow button next to the check mark button. Warning: Do not touch until it says, "Done uploading."

-
Upload the CO₂ sensor code: Download CO2SensorCode.ino and open it in Arduino IDE. Upload the program to the Arduino by clicking on the arrow button next to the check mark button.
-
Plug the Arduino into a computer, USB Power Bank, or other power supply to turn the sensor on. Whenever it is given power, the sensor system will display the current CO₂ readings on the screen and save them to a file on the SD card.


Arduino IDE / Code Upload Issues
Arduino Nano Select Processor
Wiring Intro for Beginners
SCD-30 Sensor
Alternative Method to Set Date and Time on RTC Note: Use the LCD wiring from this project instead.
Intro to SD and Micro SD Card Modules with Arduino
- Check Arduino IDE / Code Upload Issues
- Try each port option
- Try each processor option
- Swap the USB cable with another - sometimes the cables break
- Try a Loopback Test
- Most likely this is a wiring issue. Check that the wires leading to that component are matched to the correct pins and firmly attached.
- Re-upload the sensor code.
- Try a different power supply. If the current one is too weak, some components may work but others will not have enough power to operate.
- Anything between 400 ppm outdoors or in well-ventilated areas to 4000 ppm in stuffy buildings and inside cars is probably valid.
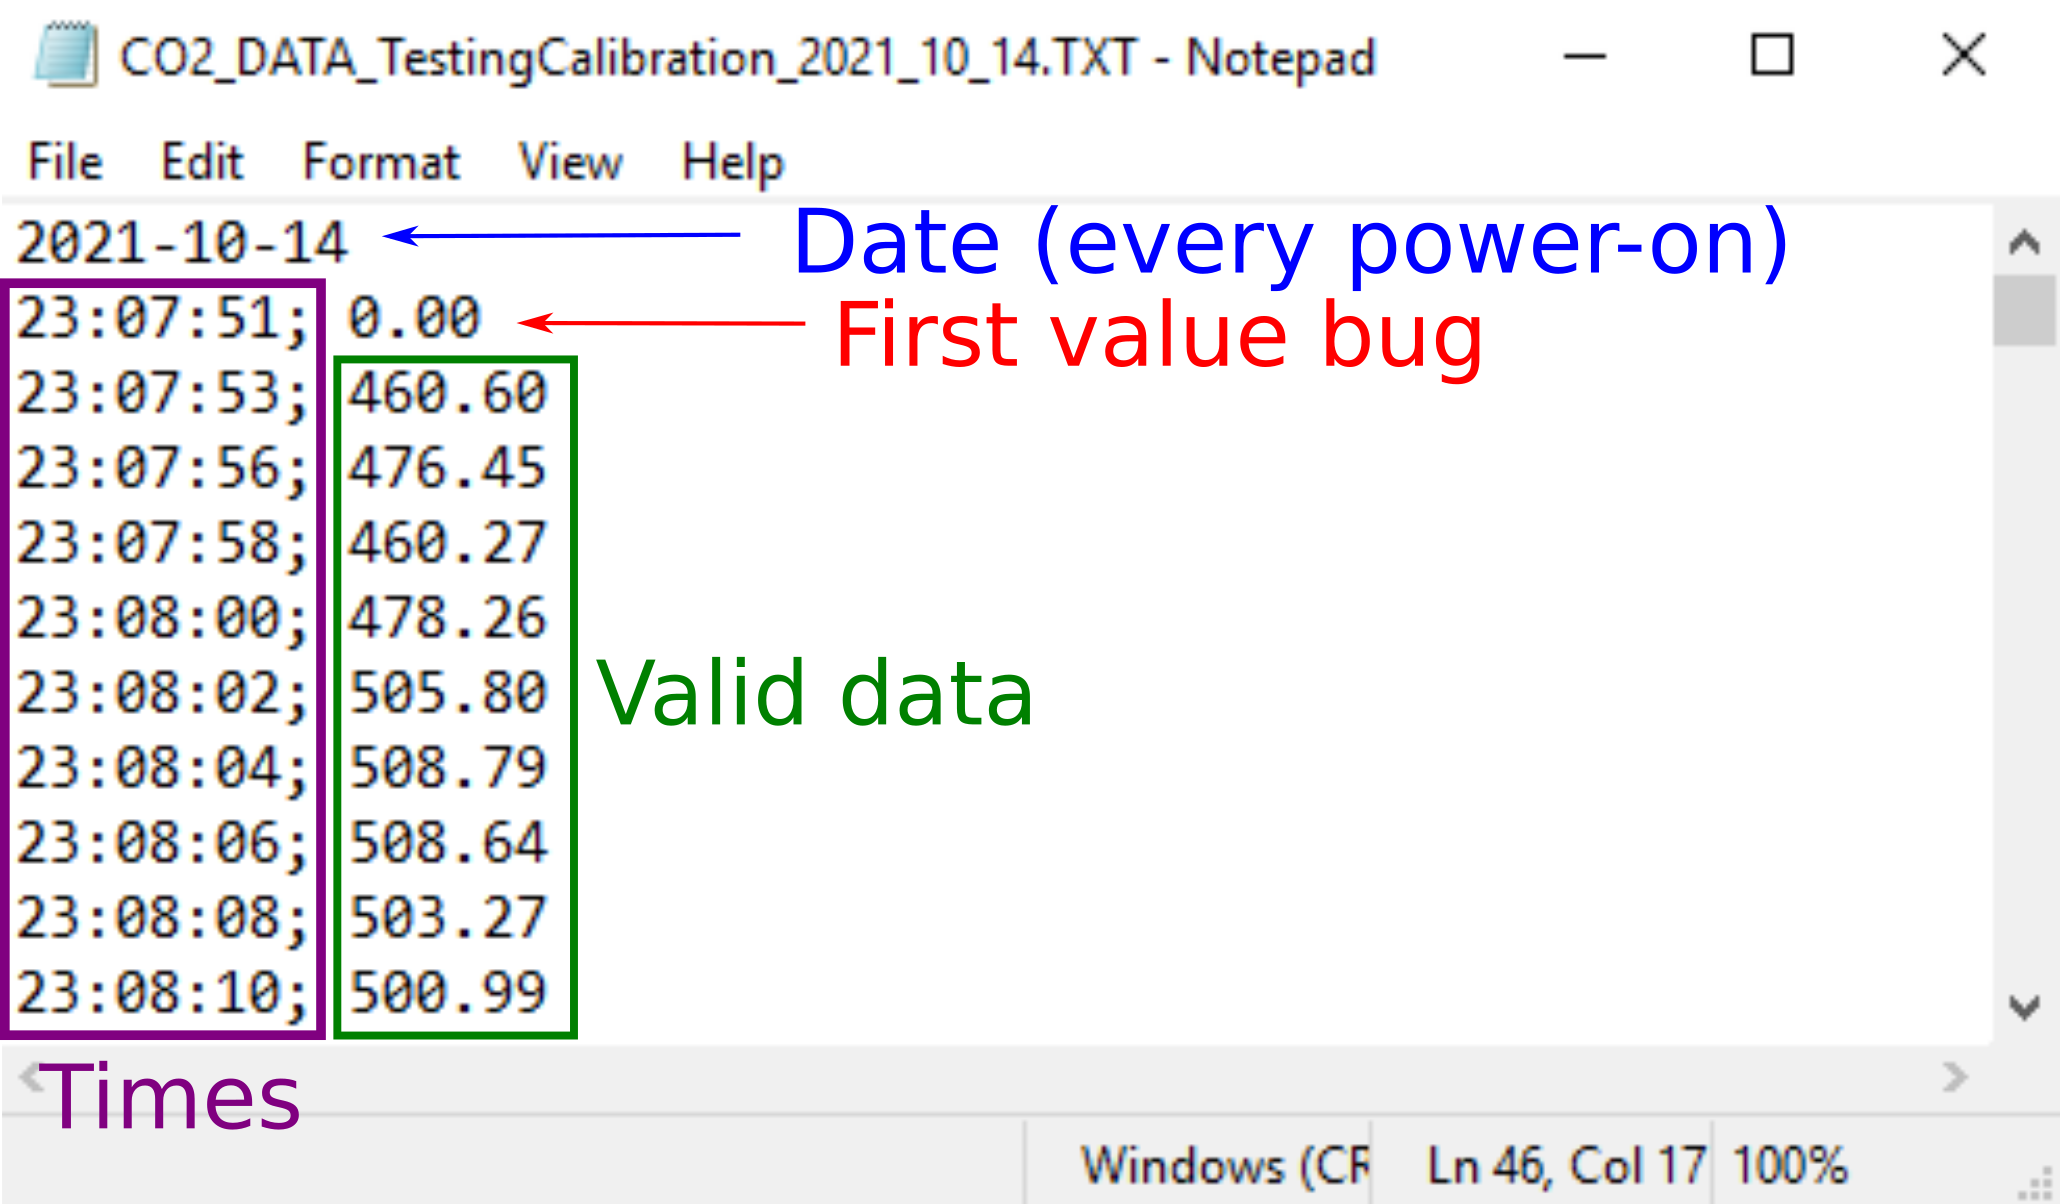
- If the first value is 0, this is a known bug. Simply ignore that value.
- Check that the cable is firmly plugged into the sensor, and the wires are properly connected to the breadboard and Arduino.
- Try swapping the cable to the other port on the SCD-30 sensor.
- The sensor is sensitive to wind; it works best to place it slightly inside the cases or place a small piece of paper between the sensor and the opening.
- Do not seal the container entirely; the sensor will not have access to the current air conditions.
- The sensor can be placed in a backpack/purse with a small (~3") opening left in the zipper so that air can circulate through.
- Do not crush the sensor by mistake. Keep it on top of any heavy objects like books and lunchboxes.
- Save your data and compare the average value at each location to the acceptable limit.
- If you know your schedule, you can match your recorded data to each specific location.
- Download the data file and delete it from the SD card after you use the sensor each day so that you can more easily keep track of your data and where you collected the data. Otherwise the data file gets large and cumbersome.
When using the sensor, you can simply read the values from the screen. However, to get a more complete picture of how safe each place is, it is necessary to analyze the data for the entire time you are there. You can upload the data to your computer from the (micro) SD card, put it into a spreadsheet program, and create graphs or analyze it.
- Remove the (Micro) SD card from the adapter module by pressing firmly and releasing until it springs out, then pulling it out gently.
- Connect the (Micro) SD card to your computer, using adapters if necessary.
- Copy the file on the card “CO2_Data.TXT” to your computer. The file is structured as follows:
- Typically, we want to import the data to a spreadsheet software like Excel or Google Sheets. We also want the times and the CO2 readings separated for so we can plot the values and compare over time. See the instructions below for your specific software.

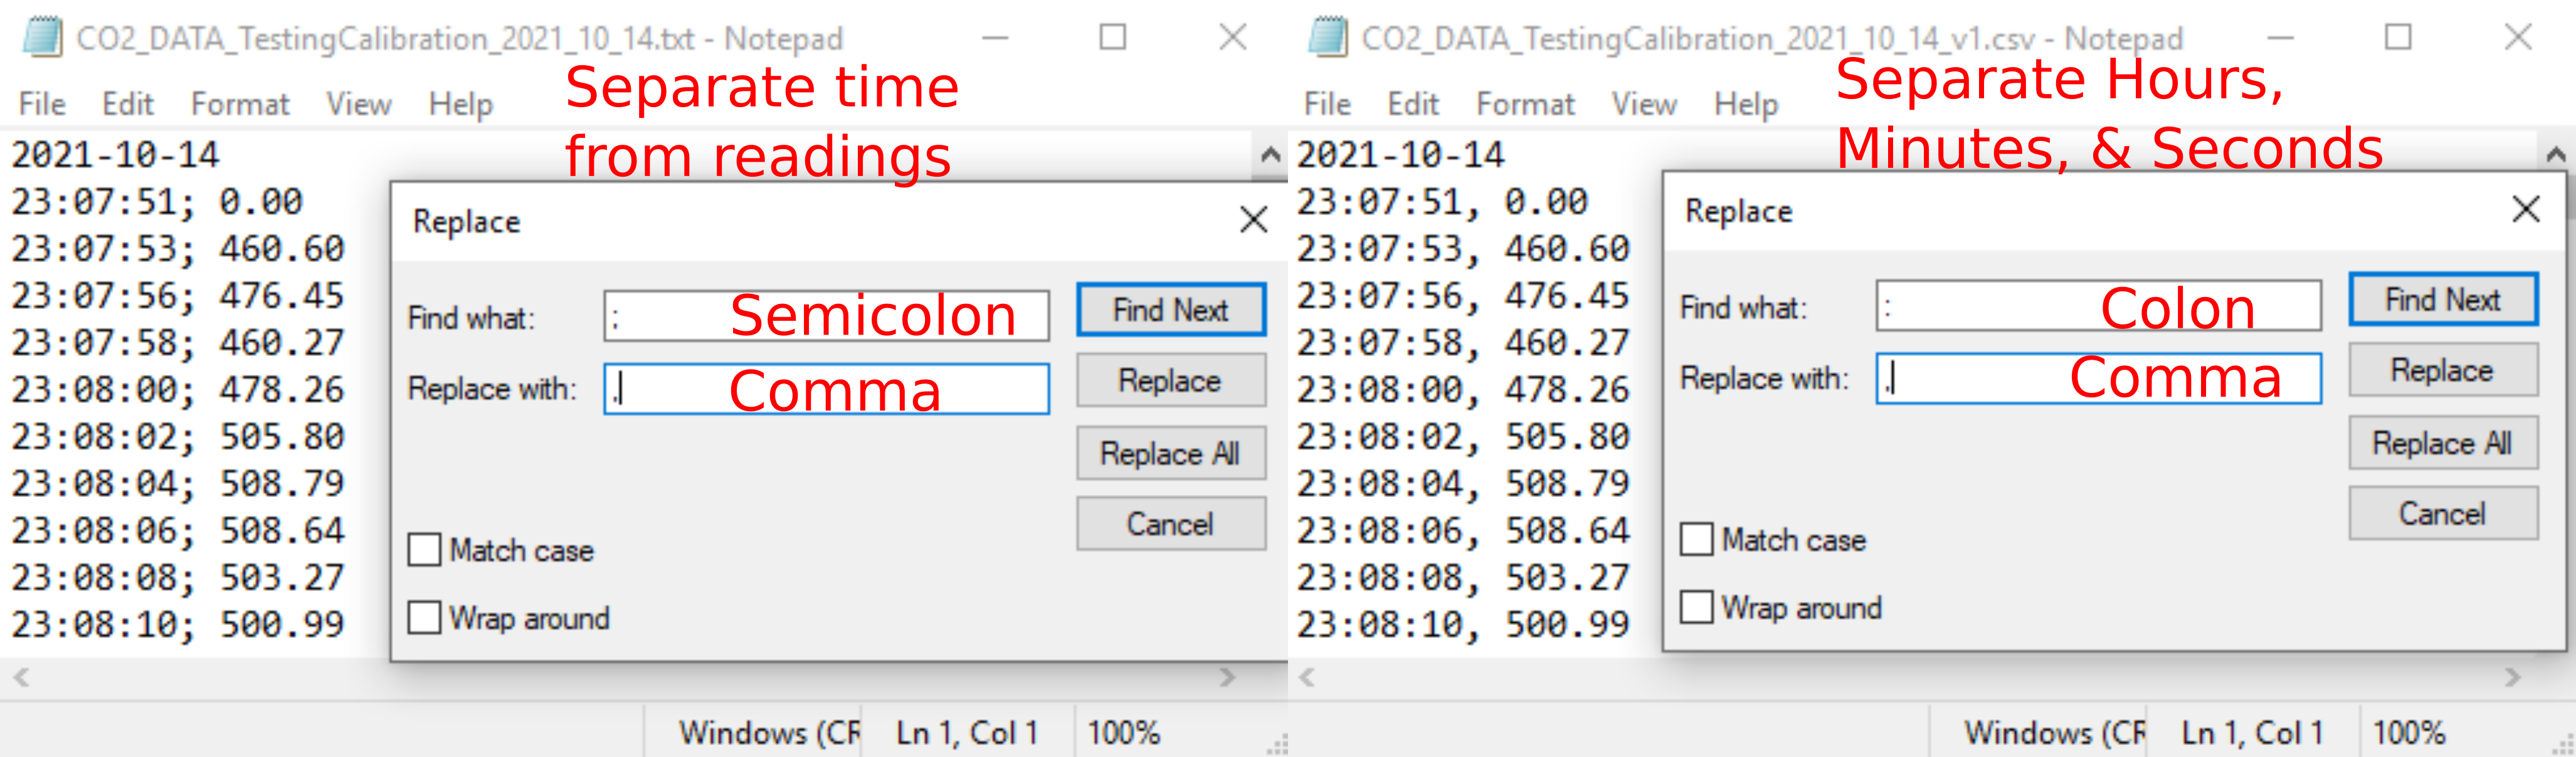
- Open the .txt file in a text editor.
- Use Find & Replace, Finding ";" (semicolon) and Replace with "," (comma). Optional: to separate the hours, minutes, and seconds into three separate columns for doing calculations like time elapsed from the start or to convert it to another date-time format, in addition Find ":" (colon), and replace with "," (comma).
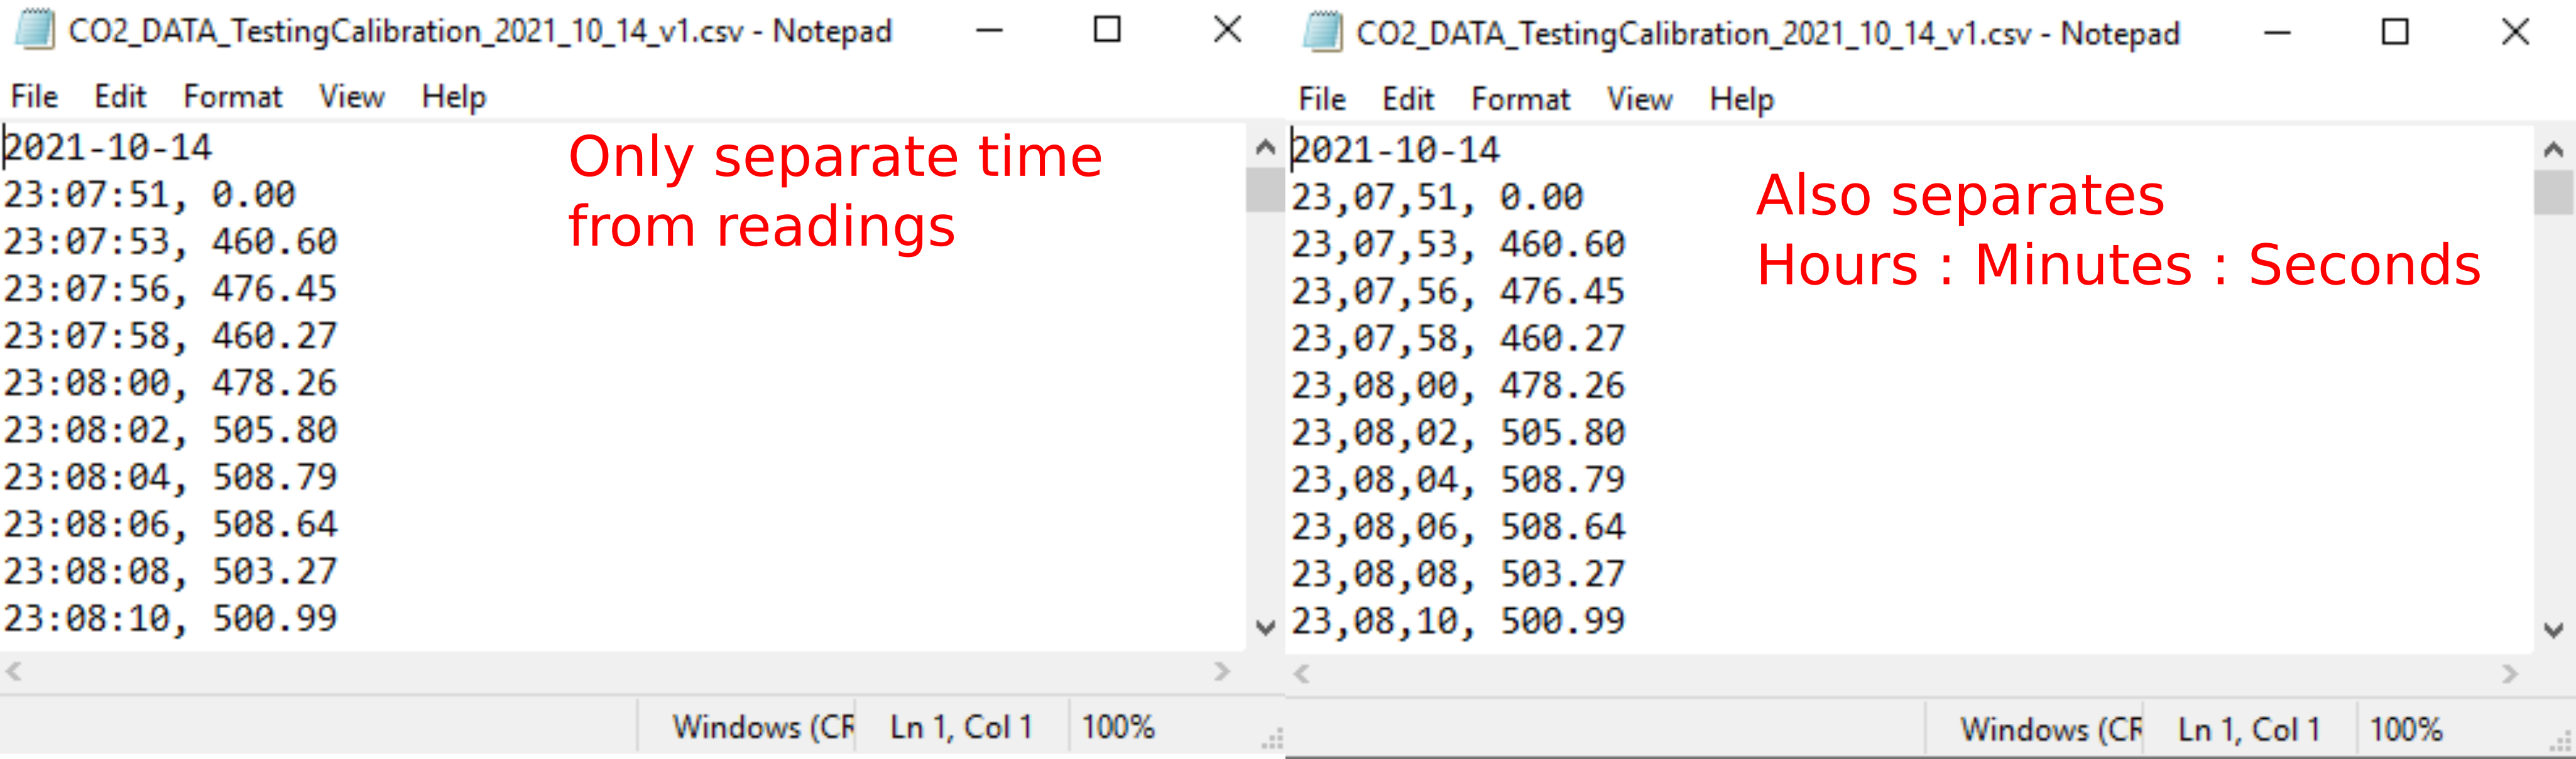
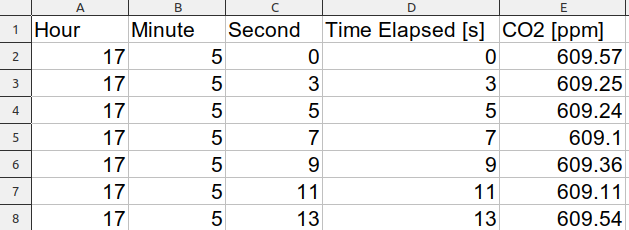
- The file will now look as follows. Left: only times and readings. Right: times separated into hours, minutes, and seconds, with readings also separated.
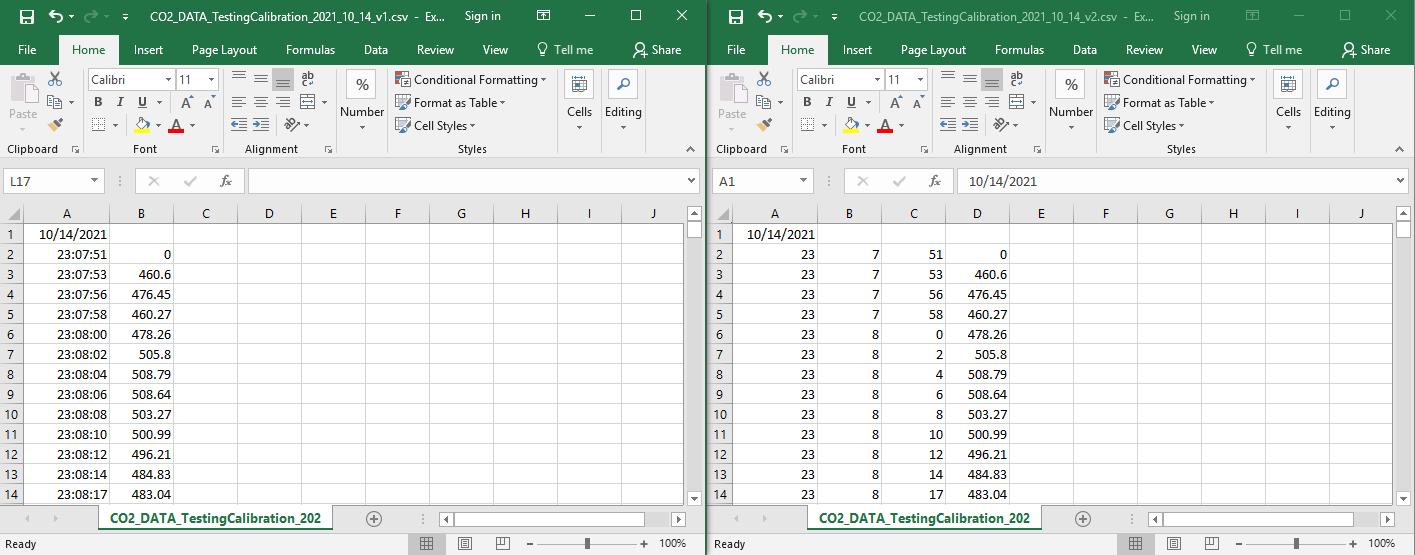
- Change the file extension to .csv (on Windows see instructions below)
- Open with your favorite spreadsheet software. Example results:


- Open Excel
- Go to the "Data" tab and select "From Text"
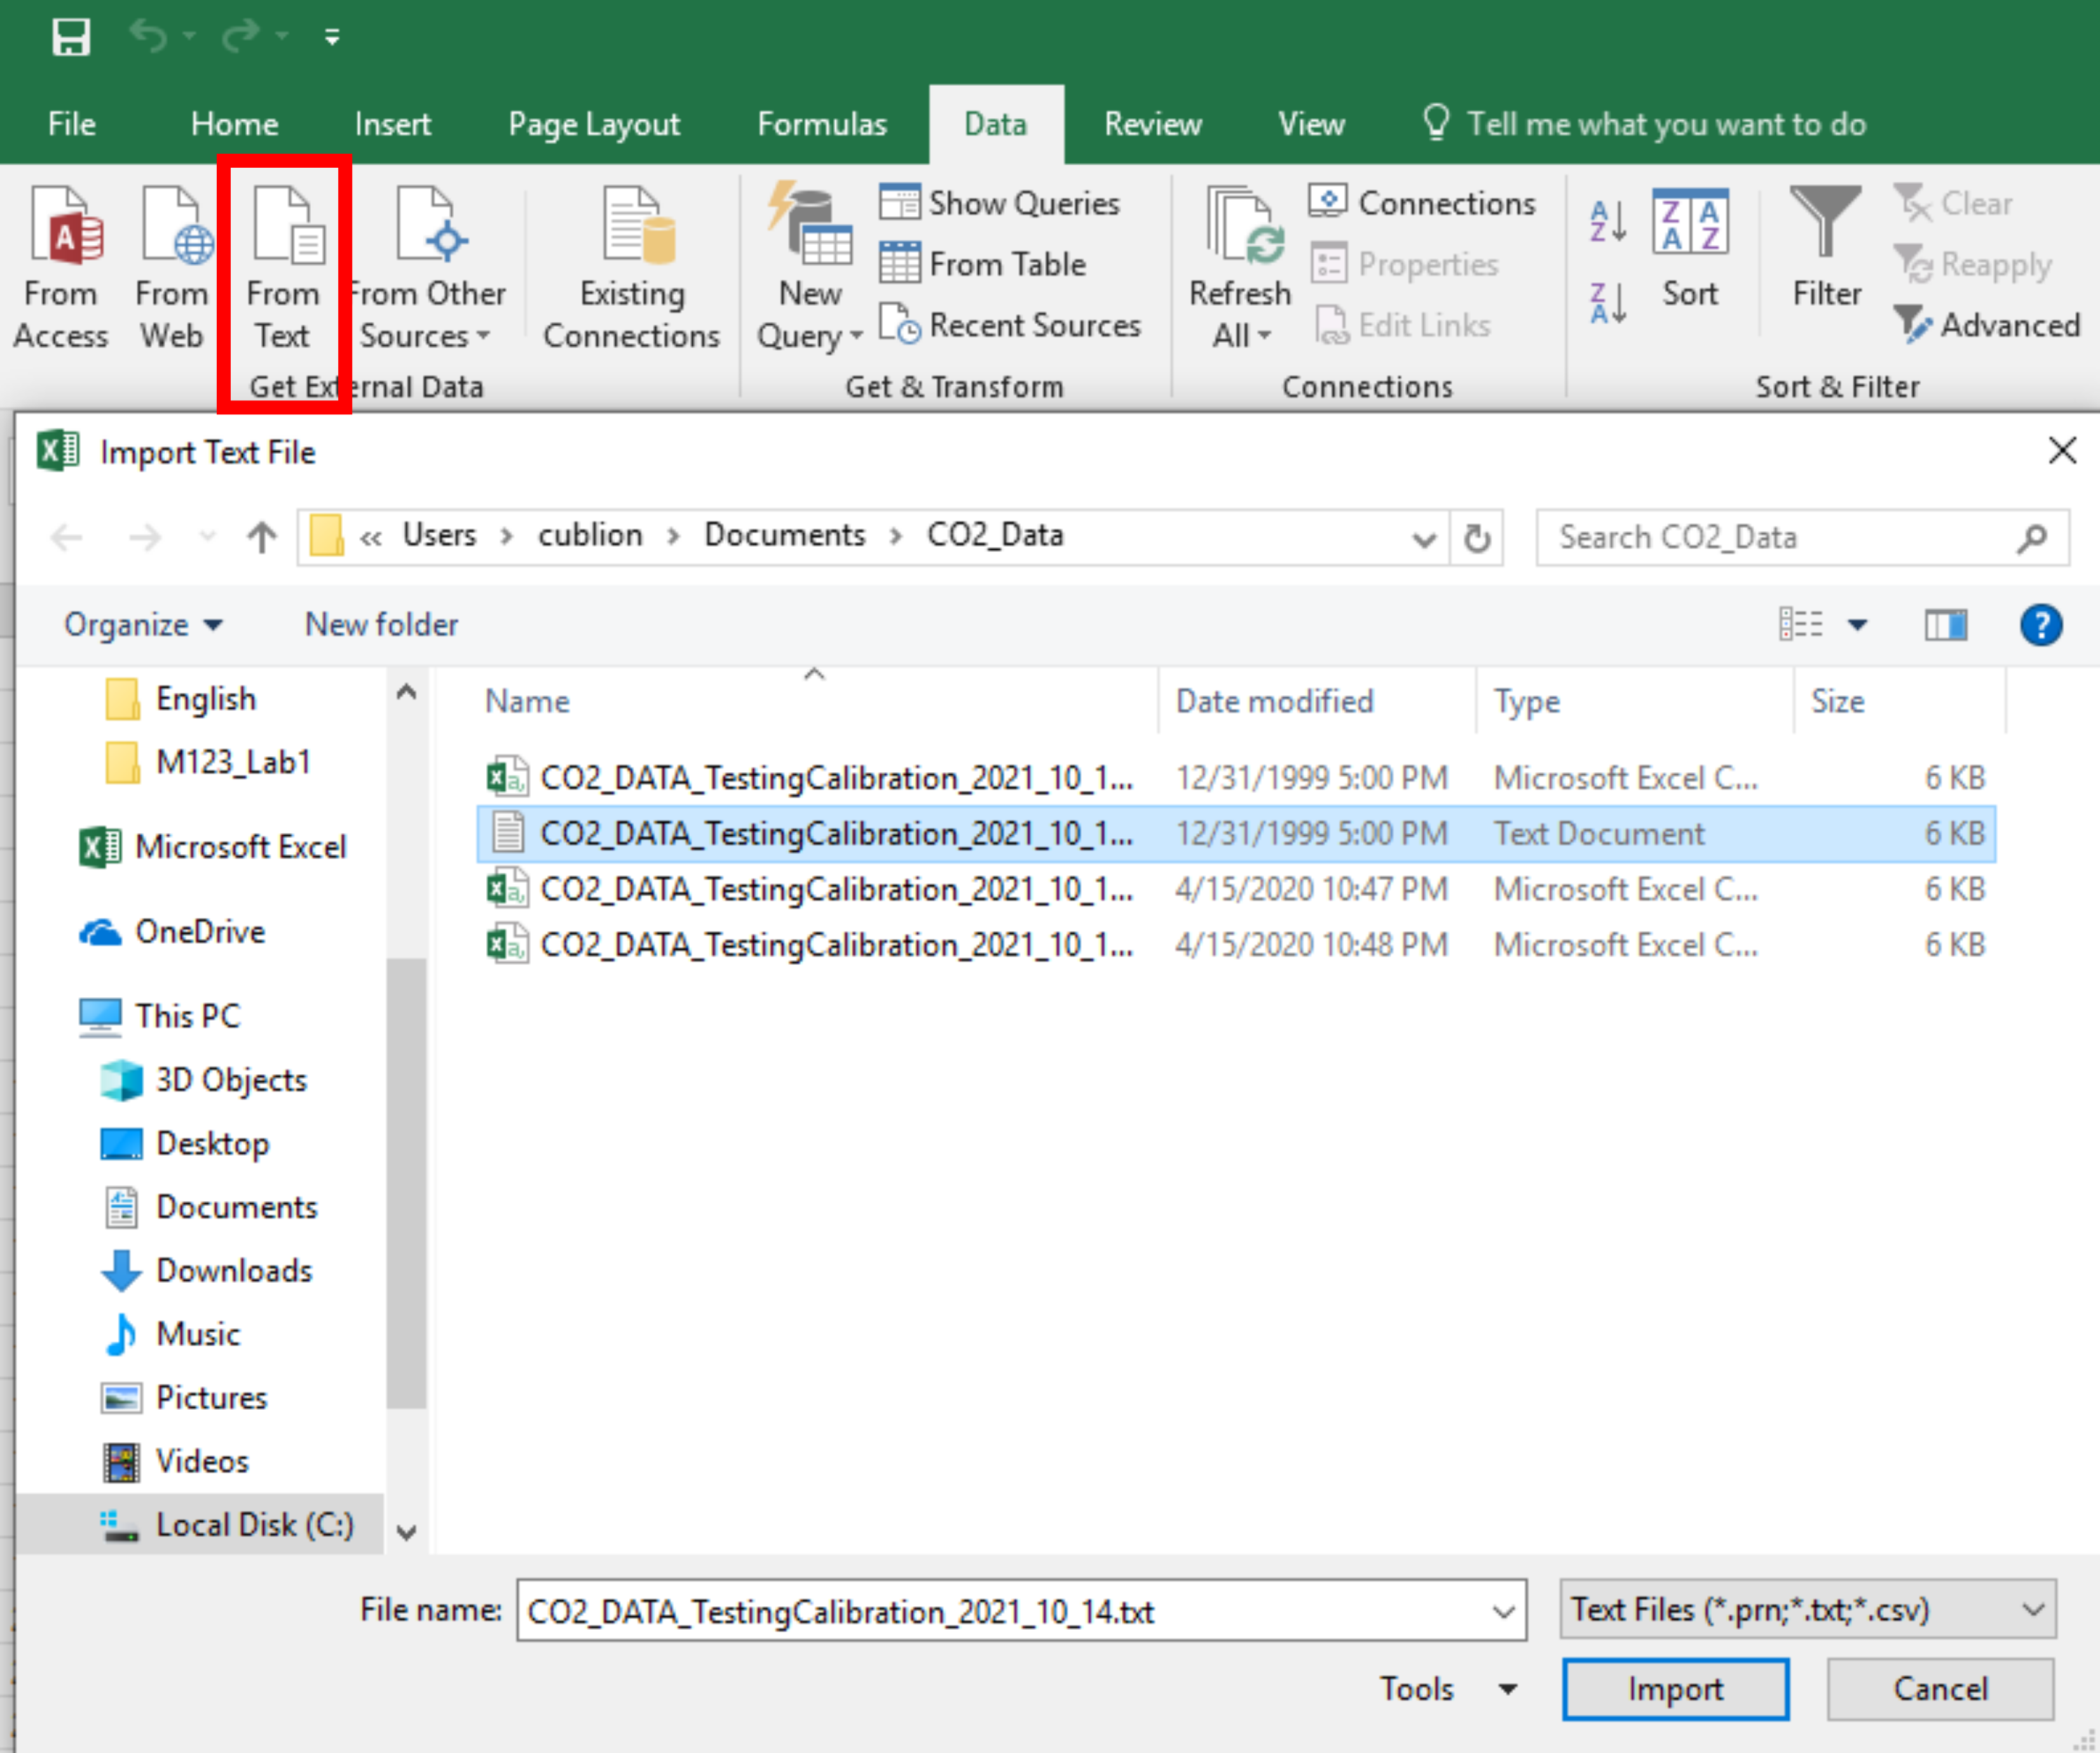
- Follow the Text Import Wizard. Make sure to select "Delimited" on the first step, and include "Semicolon" on the list of delimiters on the second step.
- Data will now be in two columns, one for time and one for the sensor readings.


- Change the file extension to .csv (on Windows see instructions below)
- Open with LibreOffice. You may need to right click then select "Open with" and choose your spreadsheet software if the computer defaults to another application.
- Choose Semicolon in the Text Import window, then click OK. The data will be imported.

- If the file extension (.txt, .csv, etc.) is not visible in File Manager, go to "View" tab and check "File name extensions"
- Rename the file to have .csv at the end instead of .txt
- If you get a warning, select "Yes."


-
To save your graphs, "Save As" and choose .xls, .xlsx, or .ods file formats.
-
To get time elapsed, convert HH:MM:SS to separate columns for hours, minutes, and seconds using the detailed instructions under "Text File Modification." Insert a new column between Seconds and CO2 [ppm]. If all zero values, date lines, and other garbage data have been removed, and there is a single header row, paste the following line of code in D2.
=C2+B2*60+A2*3600-($C$2+$B$2*60+$A$2*3600)- then select
Ctrl + Dand apply it to all the rest of the rows. The result will look something like this:
- then select
-
The first data point is recorded as 0 because the Arduino tries to record data before the initial reading is complete. This is incorrect and should be deleted.
-
Every time the Arduino is powered off and restarted, it will append the initial set of data but add a new line with the date in the form YYYY-MM-DD.
- Sometimes the sensor gets bumped and restarts unexpectedly. Searching for "-" can detect these errors. The date line needs to be removed before graphing.
- If you use the sensor for several days between downloading the data, look for these date lines to figure out when each chunk of data was collected.
- If the sensor is left on continuously past midnight, it will not create a new date line but simply jump to 00:00:00.

- Outside away from people and buildings, the sensor should read between 400 and 500 ppm.
- If you breathe directly on the sensor, it should read over 10,000 and up to 40,000.
- The sensor is very sensitive to nearby sources of CO₂. For example, we observed that the sensor reads 500-550 ppm when we walk outside with it in our backpack because our breath is enough to raise the CO₂ levels locally.
- The sensors come pre-calibrated if ordered from Adafruit. Out of 25 sensors we tested, most were within spec but a few were as low as 300ppm or as high as 660ppm without calibration. Use the calibration code for a single sensor, or assemble the calibration tool for calibrating many sensors quickly.
A company called Aranet produces CO₂ sensors that are ready to use out of the box. Many researchers have recommended them. Here's how our DIY sensor compares.
| Adafruit SCD-30 [12] | Aranet4 [13] | |
|---|---|---|
| Range: | 400-10000ppm | 0-9999ppm |
| Accuracy: | ±30 ppm + 3% | 0-2000ppm: ±50ppm ± 3% reading 2001-9999ppm: ±10% of reading |
| Accuracy At: | ||
| 420ppm (outside) | ±42.6ppm | ±62.6ppm |
| 800ppm | ±54 ppm | ±74ppm |
| 1000ppm | ±60 ppm | ±80ppm |
| 2000ppm | ±90 ppm | ±110ppm |
| 3000ppm | ±120 ppm | ±300ppm |
| Fastest supported measurement interval: | 2 seconds | 1 minute |
| Length of stored measurement data at fastest measurement interval | >30 days/GB-SD* | 3.5 days |
| Accuracy of other measurements: | ||
| Temperature: | ±0.3 °C | ±0.3 °C |
| Rel. Humidity: | ± 2 % | ± 3 % |
| Atmospheric Pressure: | ||
| Range: | Not included | 0.3 to 1.1 atm (4.4 to 16.0 psi) |
| Accuracy: | N/A | ± 1 hPa |
| Battery Type: | Rechargeable USB | 2 x AA |
| Battery Life: | ~3 days | Up to 2 years |
| Cost: | est $60-110 | $249 |
* Multiply by the size in GB of micro SD card
Eric Woo-Shem: Sensor design, assembly documentation/electrical diagrams/visualizations, programming: sensor firmware/calibration/RTC time set, component selection.
Brian Woo-Shem: Engineering guidance, research, documentation, data analysis, educational curriculum development, sensor testing and validation.
Thank you to the Santa Clara University Department of Mechanical Engineering for providing photos of sensor builds and feedback from students when this project was adapted into a laboratory for the Modern Instrumentation course.
All text, graphics, and non-code content is licensed CC BY-NC-SA
All code is licensed under the GNU General Public License v3
RTClib and Adafruit_SCD30 are Copyright (c) Adafruit Industries and used under the open source MIT license.
Arduino IDE and related components are open source and licensed under the GNU GPL v2 and/or CC BY-SA Arduino.
[1] Wang et al., Science Vol 373, Issue 981 (2021). https://www.science.org/doi/10.1126/science.abd9149
[2] Z. Peng and J. Jimenez, “Exhaled CO₂ as a COVID-19 Infection Risk Proxy for Different Indoor Environments and Activities, ACS, 2021. https://pubs.acs.org/doi/10.1021/acs.estlett.1c00183
[3] C. Mooney, “The Coronavirus is Airborne. Here’s How to Know if You’re Breathing Other People’s Breath,” The Washington Post, 2021. https://www.washingtonpost.com/health/2021/02/10/carbon-dioxide-device-coronavirus/
[4] NOAA Global Monitoring Laboratory, “Trends in Atmospheric Carbon Dioxide.” https://gml.noaa.gov/ccgg/trends/
[5] K. Alhambra and D. Czernia, CO₂ Breathing Emission Calculator. https://www.omnicalculator.com/ecology/co2-breathing-emission
[6] UK Health and Safety Executive, Ventilation and Air Conditioning During the Coronavirus Pandemic.
https://www.hse.gov.uk/coronavirus/equipment-and-machinery/air-conditioning-and-ventilation/identifying-poorly-ventilated-areas.htm
[7] V. Greenwood, "Is Conference Room Air Making You Dumber?" The New York Times, 2019. https://www.nytimes.com/2019/05/06/health/conference-room-air.html
[8] Adafruit SCD-30 Resources. https://learn.adafruit.com/adafruit-scd30
[9] G. Lambert, "How to Write Data to Files on an SD Card with Arduino," Circuit Basics. https://www.circuitbasics.com/writing-data-to-files-on-an-sd-card-on-arduino/
[10] "Arduino - RTC" Arduino Get Started. https://arduinogetstarted.com/tutorials/arduino-rtc
[11] Adafruit RTClib, GitHub. https://github.com/adafruit/RTClib/tree/master/examples
[12] Adafruit, "Adafruit SCD-30 - NDIR CO2 Temperature and Humidity Sensor - STEMMA QT / Qwiic." https://www.adafruit.com/product/4867
[13] CO2Meter.com, "Aranet4 HOME Indoor Air Quality Monitor" https://www.co2meter.com/products/aranet4-home-indoor-air-quality-monitor
[14] CO2Meter.com, "CO2 Sensors Improve Energy Efficiency in HVAC," 2022. https://www.co2meter.com/blogs/news/co2-sensors-hvac-energy-efficiency
[15] Honeywell, "Carbon Dioxide (CO₂) HVAC Basics," 1998. https://customer.honeywell.com/resources/Techlit/TechLitDocuments/63-0000s/63-7049.pdf
[16] Aclima Air.health: Look up CO₂ levels for any address in the San Francisco Bay Area.