Georgetown University
School of Continuing Studies
Data Science Certificate Capstone Project
Karen Belita - @kbelita
Veronica Helms - @vevahelms
Emily Pugliese - @emilypugliese
Hua Zhong - @hzhongDC
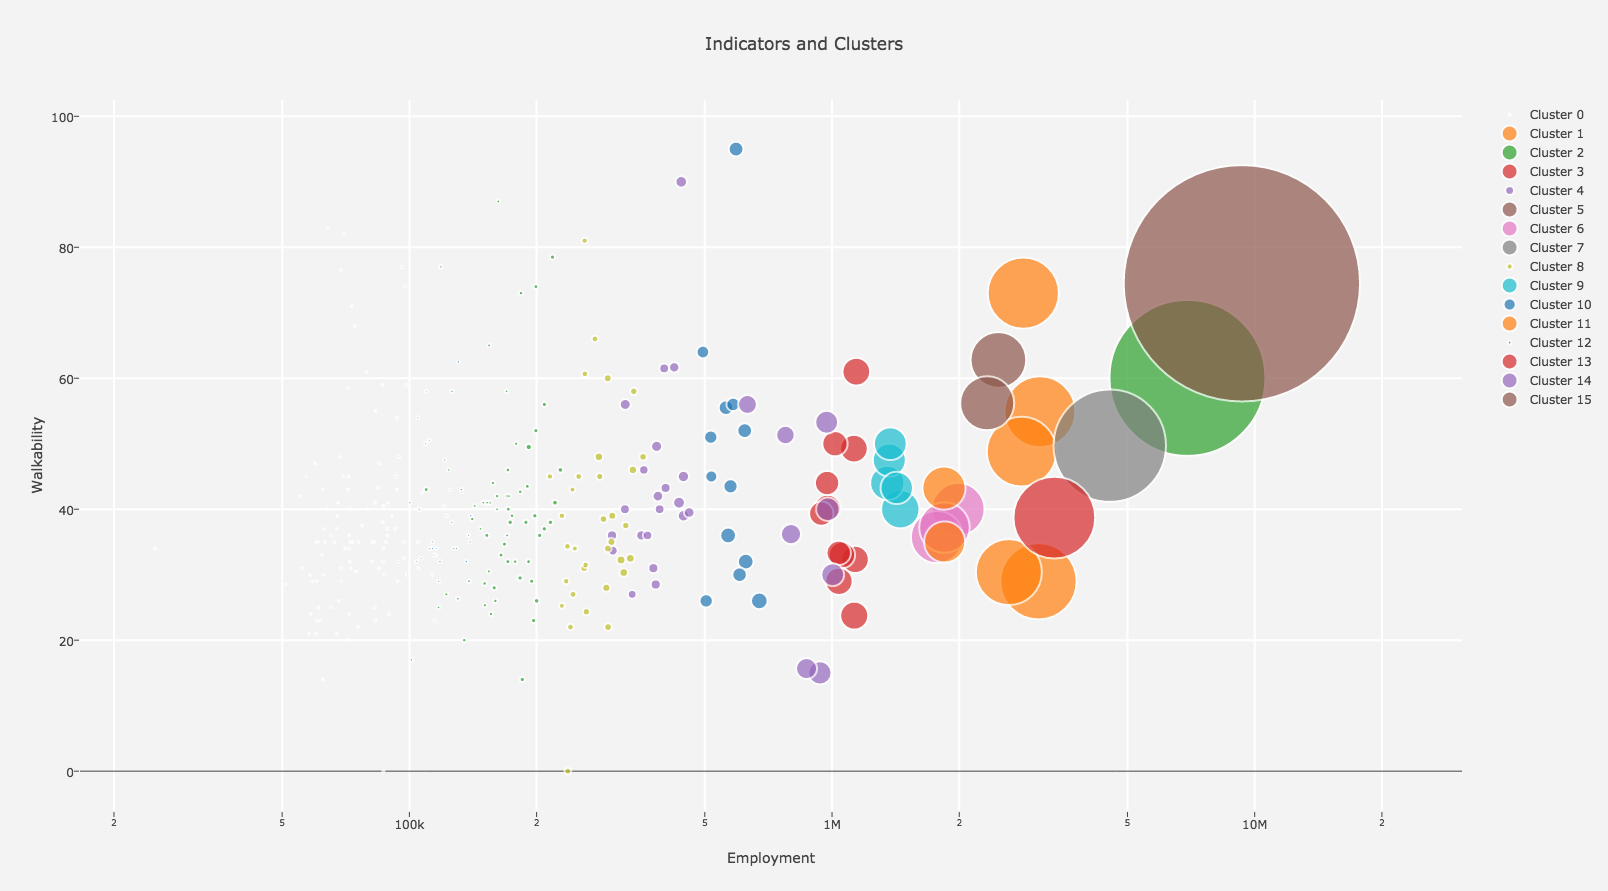
Millennials represent one-quarter (24%) of the United States population but made up almost half (43%) of all movers during 2007-2012. This unique demographic population resides in urban areas at higher rates than any other generation and surveys suggest that the majority of millennials prefer living in metropolitan areas. Urban Home Finder was developed as an application to provide a platform for millennials to input preferences associated with metropolitan centers. The application’s purpose is to assist users in choosing their next urban home wisely. Using underlying machine learning processes, user inputs predict urban areas aligned with user preferences. Eight data sources at varying levels of geography were ingested and wrangled to extract forty features from structured raw data files. With a final dataset containing indicators for over twenty topics, two machine learning processes, unsupervised and supervised, were employed to label, describe, and analyze the data. Clustering was used to assign 300 metropolitan statistical areas, the measure used to define an urban center, into sixteen clusters. Classification techniques were used to describe clusters and select the best predictor model. K-nearest neighbors using all forty features was selected as the final predictor model and outputted a F1 score of 0.96. Within a Jupyter notebook, slider widgets were employed to allow users a platform for preference input. In the final application, the predictor model uses five inputs determined to be userrelevant via domain expertise while the remaining thirty-five indicators remained constant. Using inputs, the final predictor model outputs one to five recommended metropolitan areas. In conjunction with the widgets, Plotly was used to provide an interactive user interface to compare clusters alongside primary user preferences.
Project Purpose: Provide a platform to determine a metropolitan area of interest based on user
preferences.
Unit of Analysis: Metropolitan Statistical Areas (MSAs) represent core urban areas consisting of a
50,000 or more population. As of July 2015, 389 MSAs were delineated. Urban Home Finder analyzes
300 MSAs.
Research Questions:
What characteristics do millennials prioritize when considering metropolitan areas?
What features predict MSA selection?
Hypothesis: The most predictive features of a MSA will be rent burden, employment, and crime.
Ingestion: Download data from data sources using their API or download directly from their website.
Wrangling: Clean and organize data in preparation for storage and analysis.
Normalization: Store and merge clean data in PostgreSQL.
Machine Learning: Employ unsupervised and supervised machine learning methods to describe data and select predictive model for application.
Application: Create interactive visualizations and an ipywidgets slider that serves as a recommender application.
American Community Survey
USDA Food Atlas
Walkability Index
National Assessment of Educational Progress
FBI Uniform Crime Reporting
BLS Unemployment Reporting
Public Transportation Safety
ing-wr: Folder contains ingestion and wrangling python scripts and notebooks.
storage: Folder contains scripts for creating the database in PostgreSQL, loading data into PostgreSQL, and generating a csv file with data ready for analysis and machine learning.
ml-application: Folder contains notebooks for unsupervised and supervised machine learning, application, and visualizations.

