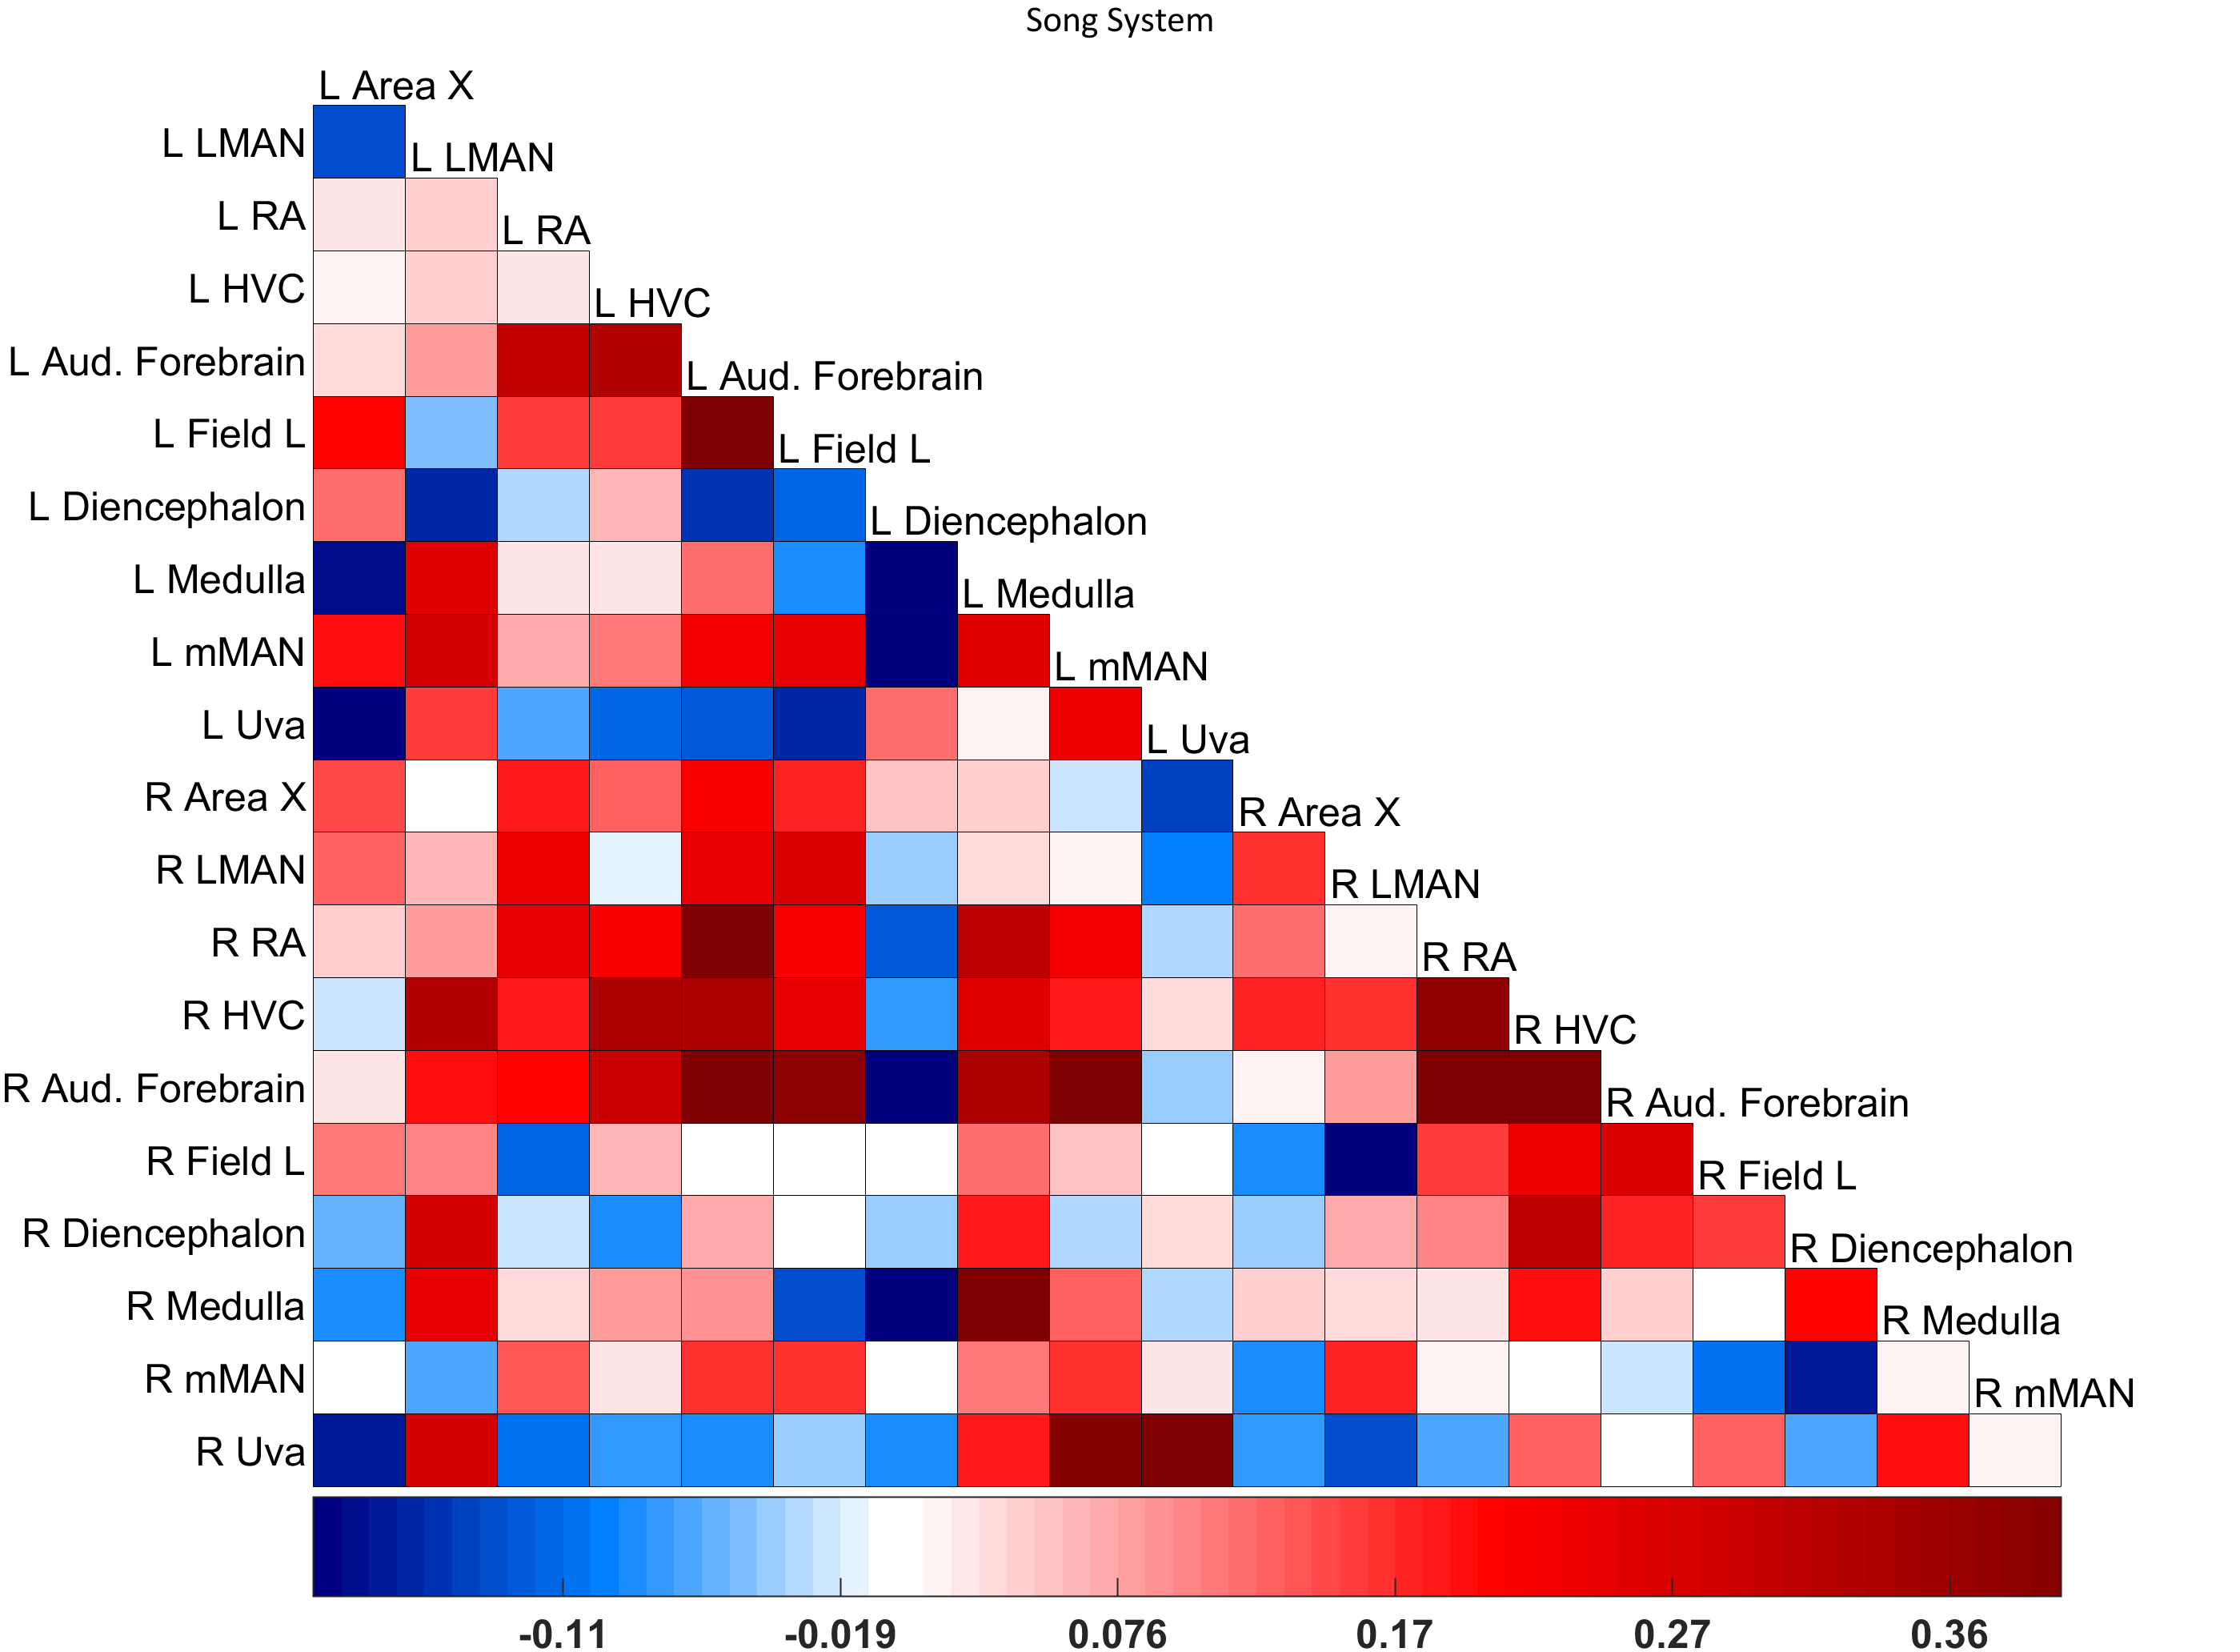
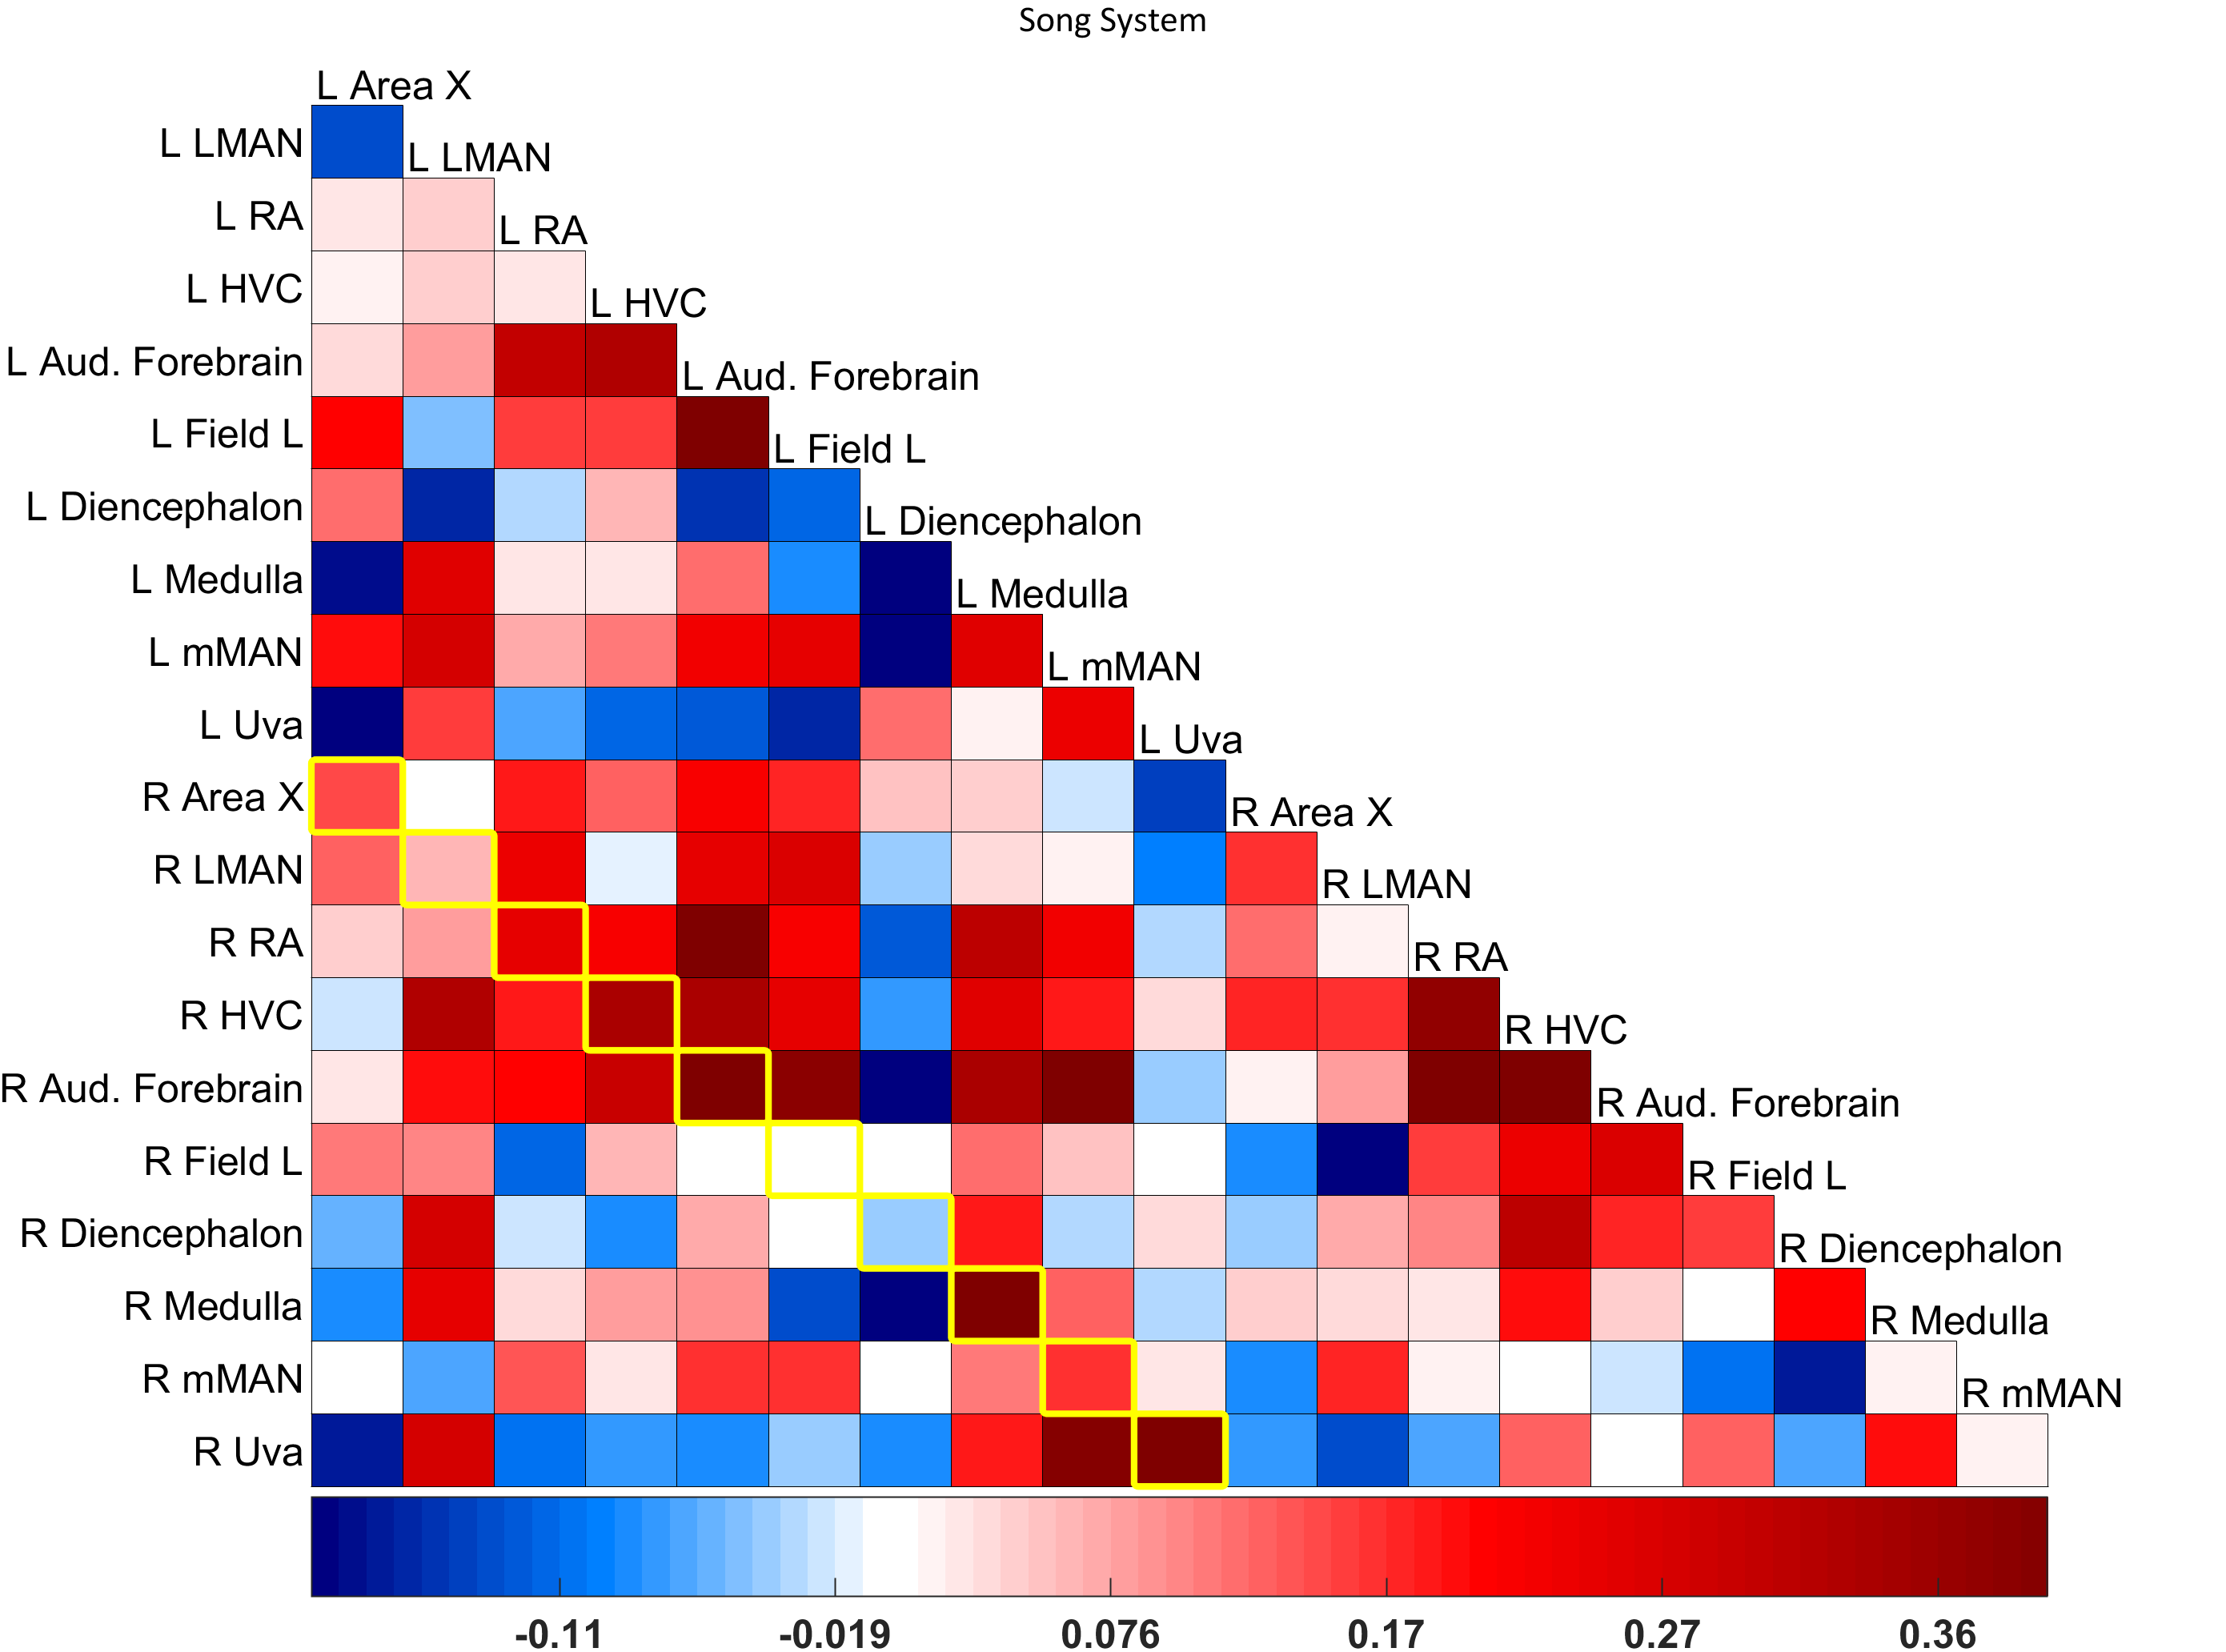
A Matlab utility for plotting correlation matrices, with similar appearance to Seaborn in Python.
I created this function to allow flexible, customizable plotting of correlation matrices for brain functional connectivity data. However, it works for plotting any correlation matrix or grid data. If desired, it is capable of computing correlation matrices directly from fMRI images, and can even complete simple preprocessing like detrending and bandpass filtering. The plot_corrmat.m help section contains documentation for all input parameters, as well as many helpful hints.
Please cite:
Layden, E. A., Schertz, K. E., London, S. E., & Berman, M. G. (2019). Interhemispheric functional connectivity in the zebra finch brain, absent the corpus callosum in normal ontogeny. NeuroImage, 195, 113-127.
https://www.sciencedirect.com/science/article/abs/pii/S1053811919302642
The function was created as part of this work, and it was used to generate Figure 2, panel 1 from the paper, reproduced below.
If you find plot-corrmat useful and would like to support its continued development, feel free to send a cup of coffee! :)


