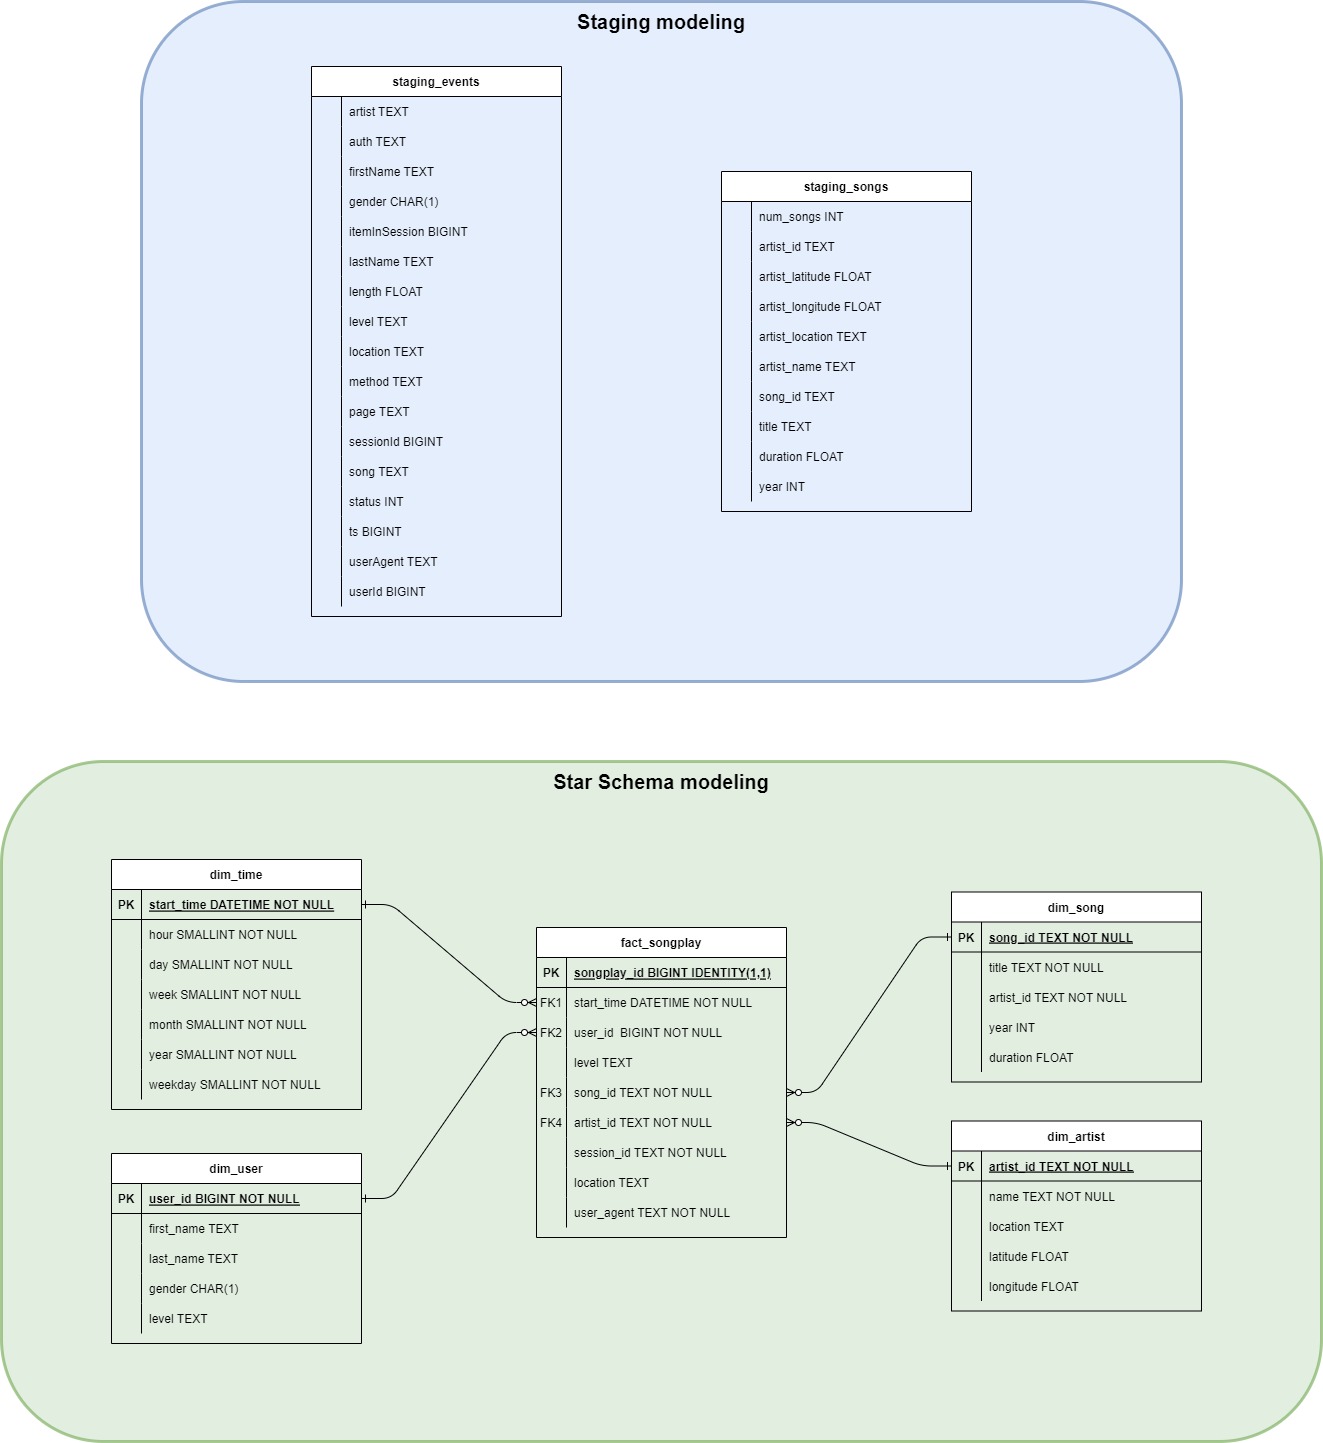
This project is about structuring an analytical solution from identifying the data source to delivering the data to the end user!
In the "lab" file you will find the code that runs the table creation scripts, etl processes and some analyzes that can help with business issues.
Below you will find more information about building the solution and the line of thought to arrive at the final result.
The data model presented below refers to the data sources of logs and sounds. Staging modeling represents the intermediate layer of data, where it will be loaded raw into Redshift databases.
After processing the data, they will be loaded into the data warehouse, which has the structure and approach shown in the "Star Schema modeling" diagram.
This chapter will explain a bit more about the approach to build the solution for Sparkfy analysis.
The initial data sources consist of json type files.
- Songs - This dataset contains data on songs and their respective artists.
- Logs - This dataset was generated using an event generator to simulate a music streaming app.
After understanding the structure of the data sources, the approach of loading them raw into the staging area was used so that they could be easily explored.
To load the data, the COPY function was used, which is optimized and allows working in parallel with the ingestion of data from multiple files within Redshift.
Once the raw data is properly stored in the staging area, the SQL language is used to extract the data from these tables, transform and standardize it and subsequently insert it into the structured tables.
For analytical modeling, the star schema structural approach was used, resulting in 5 final tables.
- fact_songplay - Fact table that will store the simulated streaming events from the Sparkfy app.
- dim_users - Dimension table that will store the application's unique user data.
- dim_song - Dimension table that will store the unique song's metadata.
- dim_artist - Dimension table that will store metadata related to unique artists.
- dim_time - Dimension table responsible for storing event date and time variations such as day, hour, month and year.
The data warehouse allows for an easy understanding of data, in addition to optimizing queries and analyzes as it consists of a low volume of relationships between tables and does not use advanced normal forms.
The following data types were used in the modeling considering table storage space, raw data accuracy and completeness, standardization, and ease of handling during end-user analyses.
- TEXT
- BIGINT
- FLOAT
- SMALLINT
- DATETIME
Some tables allow null data to be displayed for the business and technology area to identify possible gaps that have not been noticed, which can generate doubts and implement data quality with the aim of enriching the final insights.
Below you will find some business questions that are answered in the notebook named "business_analysis".
- What is the time period analysed?
- Which locations have the most users using the app?
- What are the most played artists?
- What are the most played artists segmented by location?
- What are the most played songs?
- What are the most played songs segmented by location?
- How many users do we have for the different existing levels?
- What are the most popular user agents?
- What are the most used user agents segmented by user level?
