In this Module 2 challenge, we helped a client named Steve get a better outlook of potential stocks to invest in. At first, we did stock analysis on one stock with the ticker, DQ, known as Daqo New Energy Corp, then, we extrapolated the analysis to include 12 tickers total during the years 2017 and 2018. This involved learning how to add the Developer Tab to Excel, create a module for a macro, start the macro with Sub macroName(), activate a worksheet in Excel to execute a macro or subroutine on, input text into a cell using Range("").Value = "", create header rows for our different columns using Cells(row, column).Value = "", create variables of varying types using Dim, understanding variable types such as string, integer, single, double, and long, learn how to make comments with ', creating a variable to allow looping though a sheet's rows, running a For loop using an iterator, i, learning to use conditional expressions like If, Then, Else, ElseIf, End If, outputting values to cells, and finally making buttons in Excel that are assigned to macros. To help our client see the stock analysis results easier, we incorporated a macro that ran conditional formatting code.
The challenging part of the analysis was filling the columns titled: "Ticker", "Total Daily Volume, and "Return", with accurate data by using conditional If expressions within nested For loops. After running into overflow bugs and subscript out of range errors, using the local variables window during debugging truly helped correct the project.
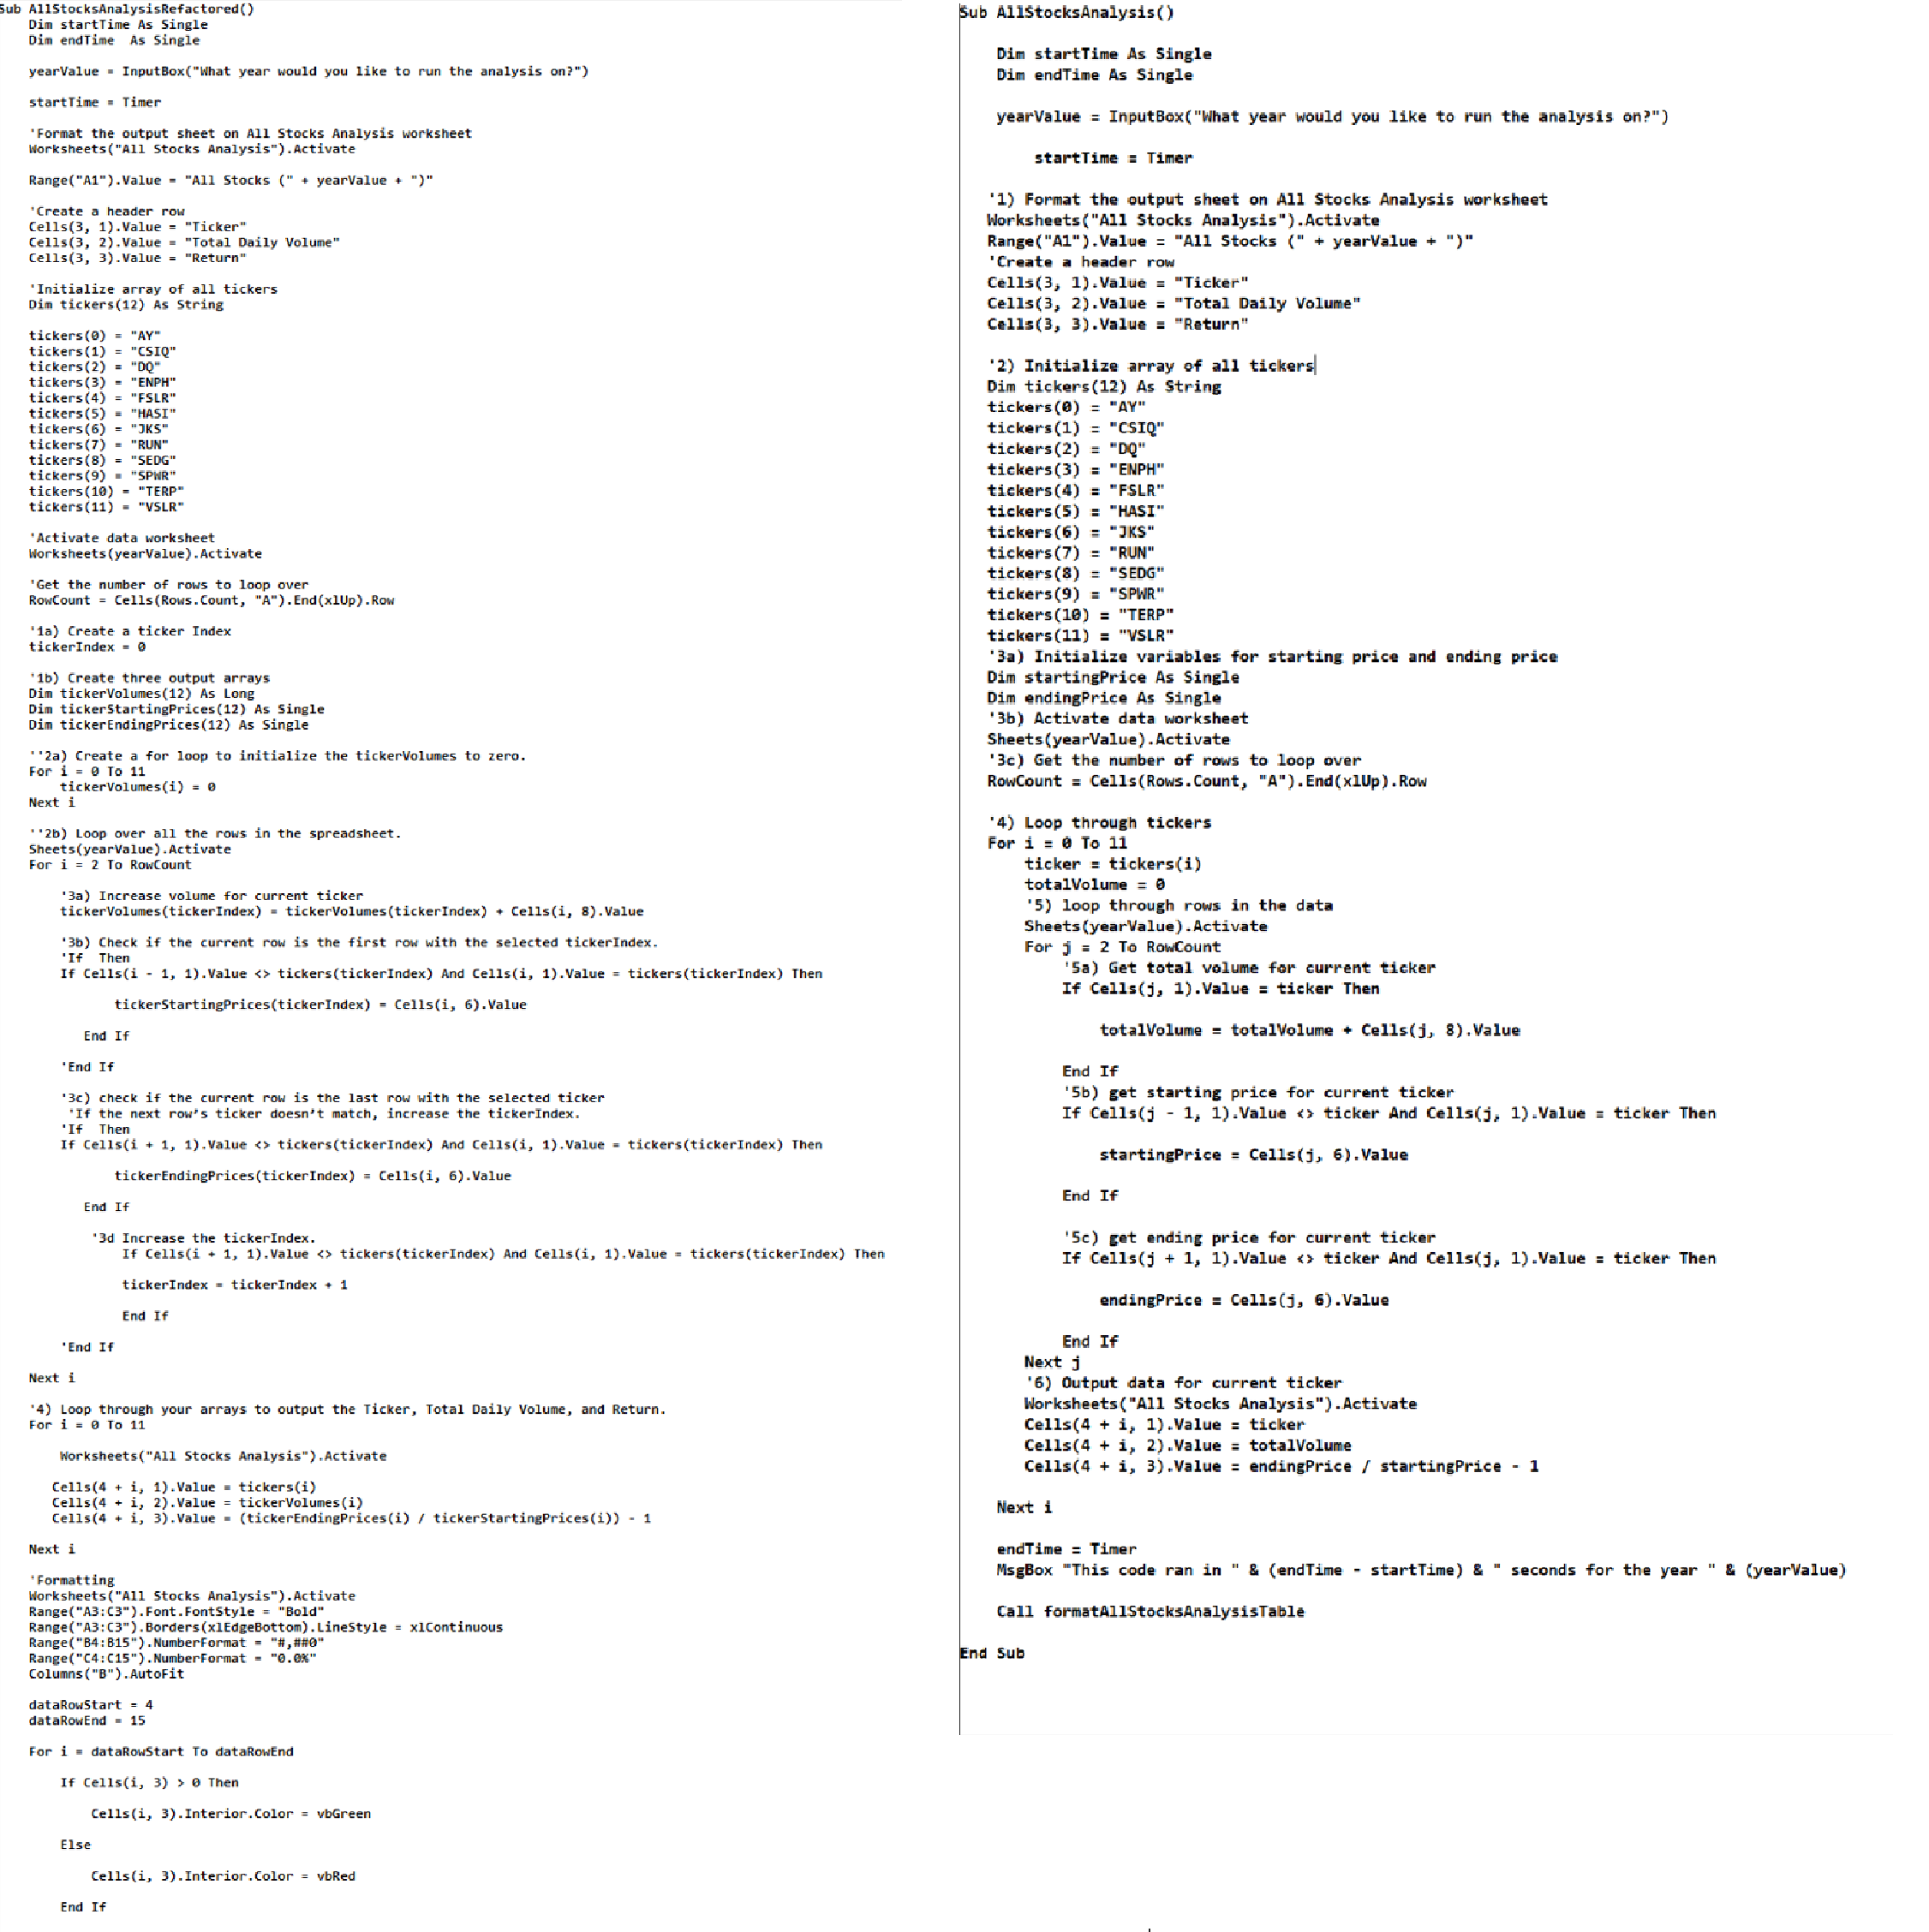
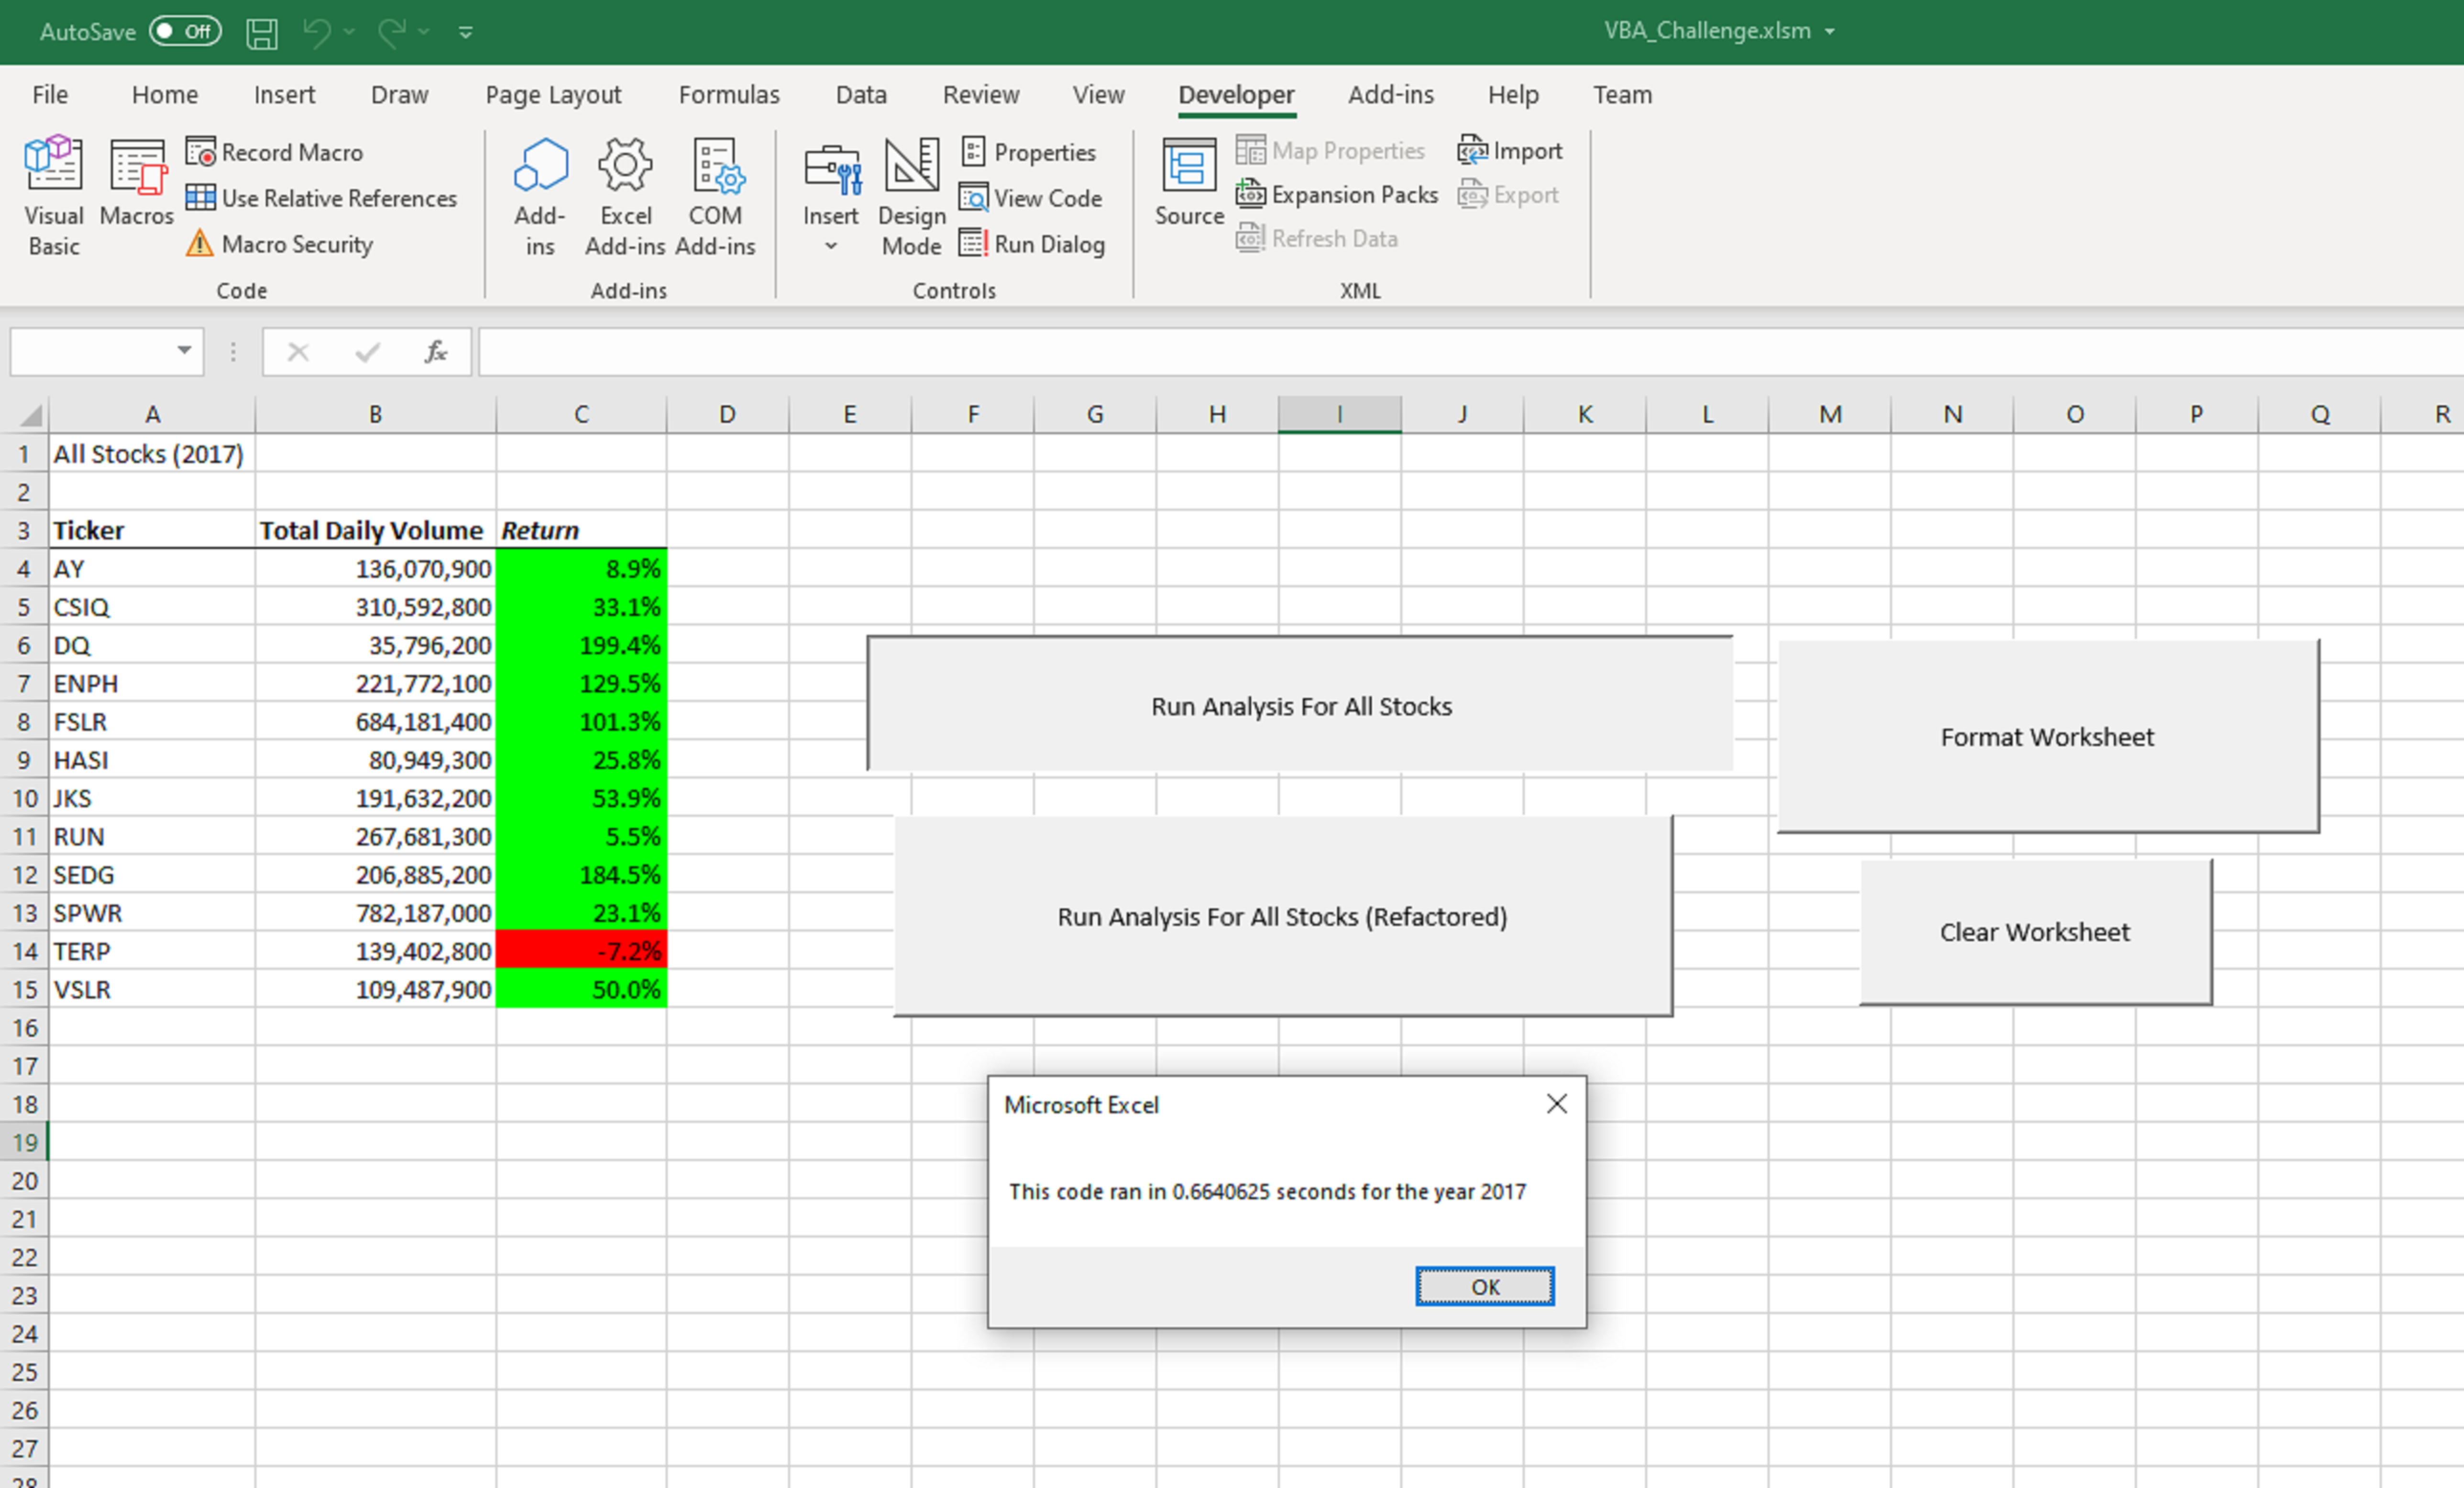
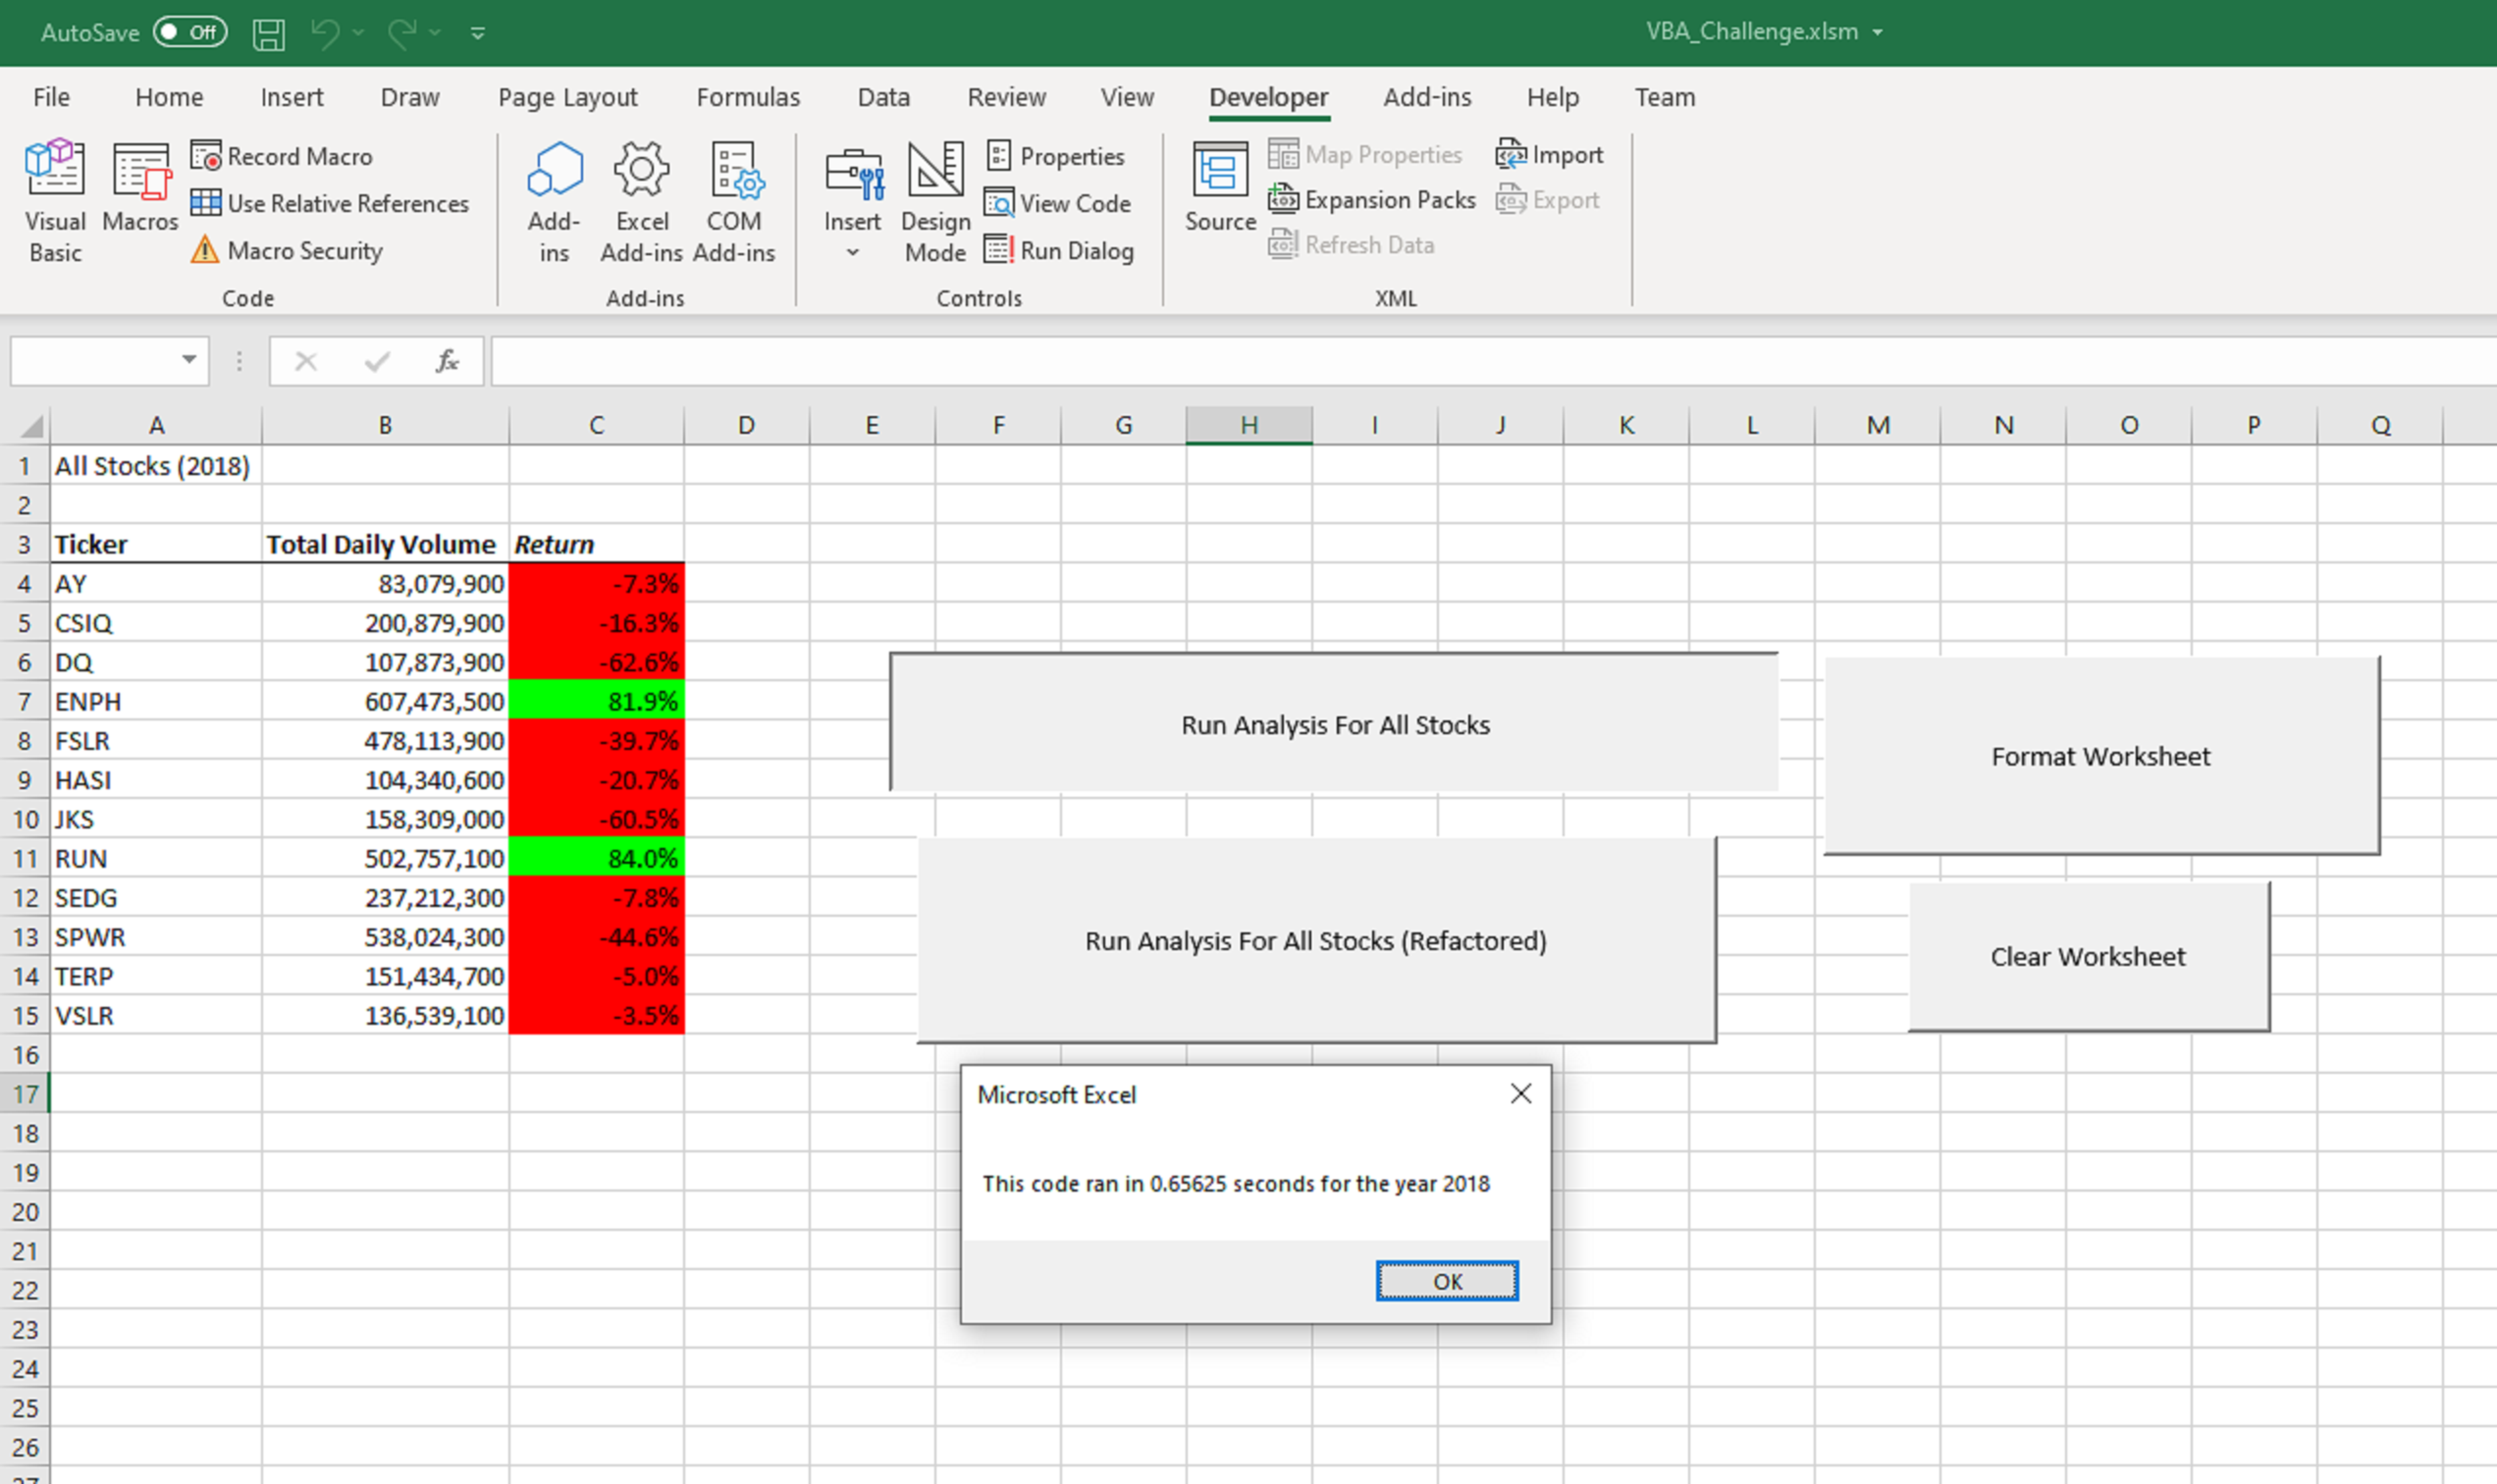
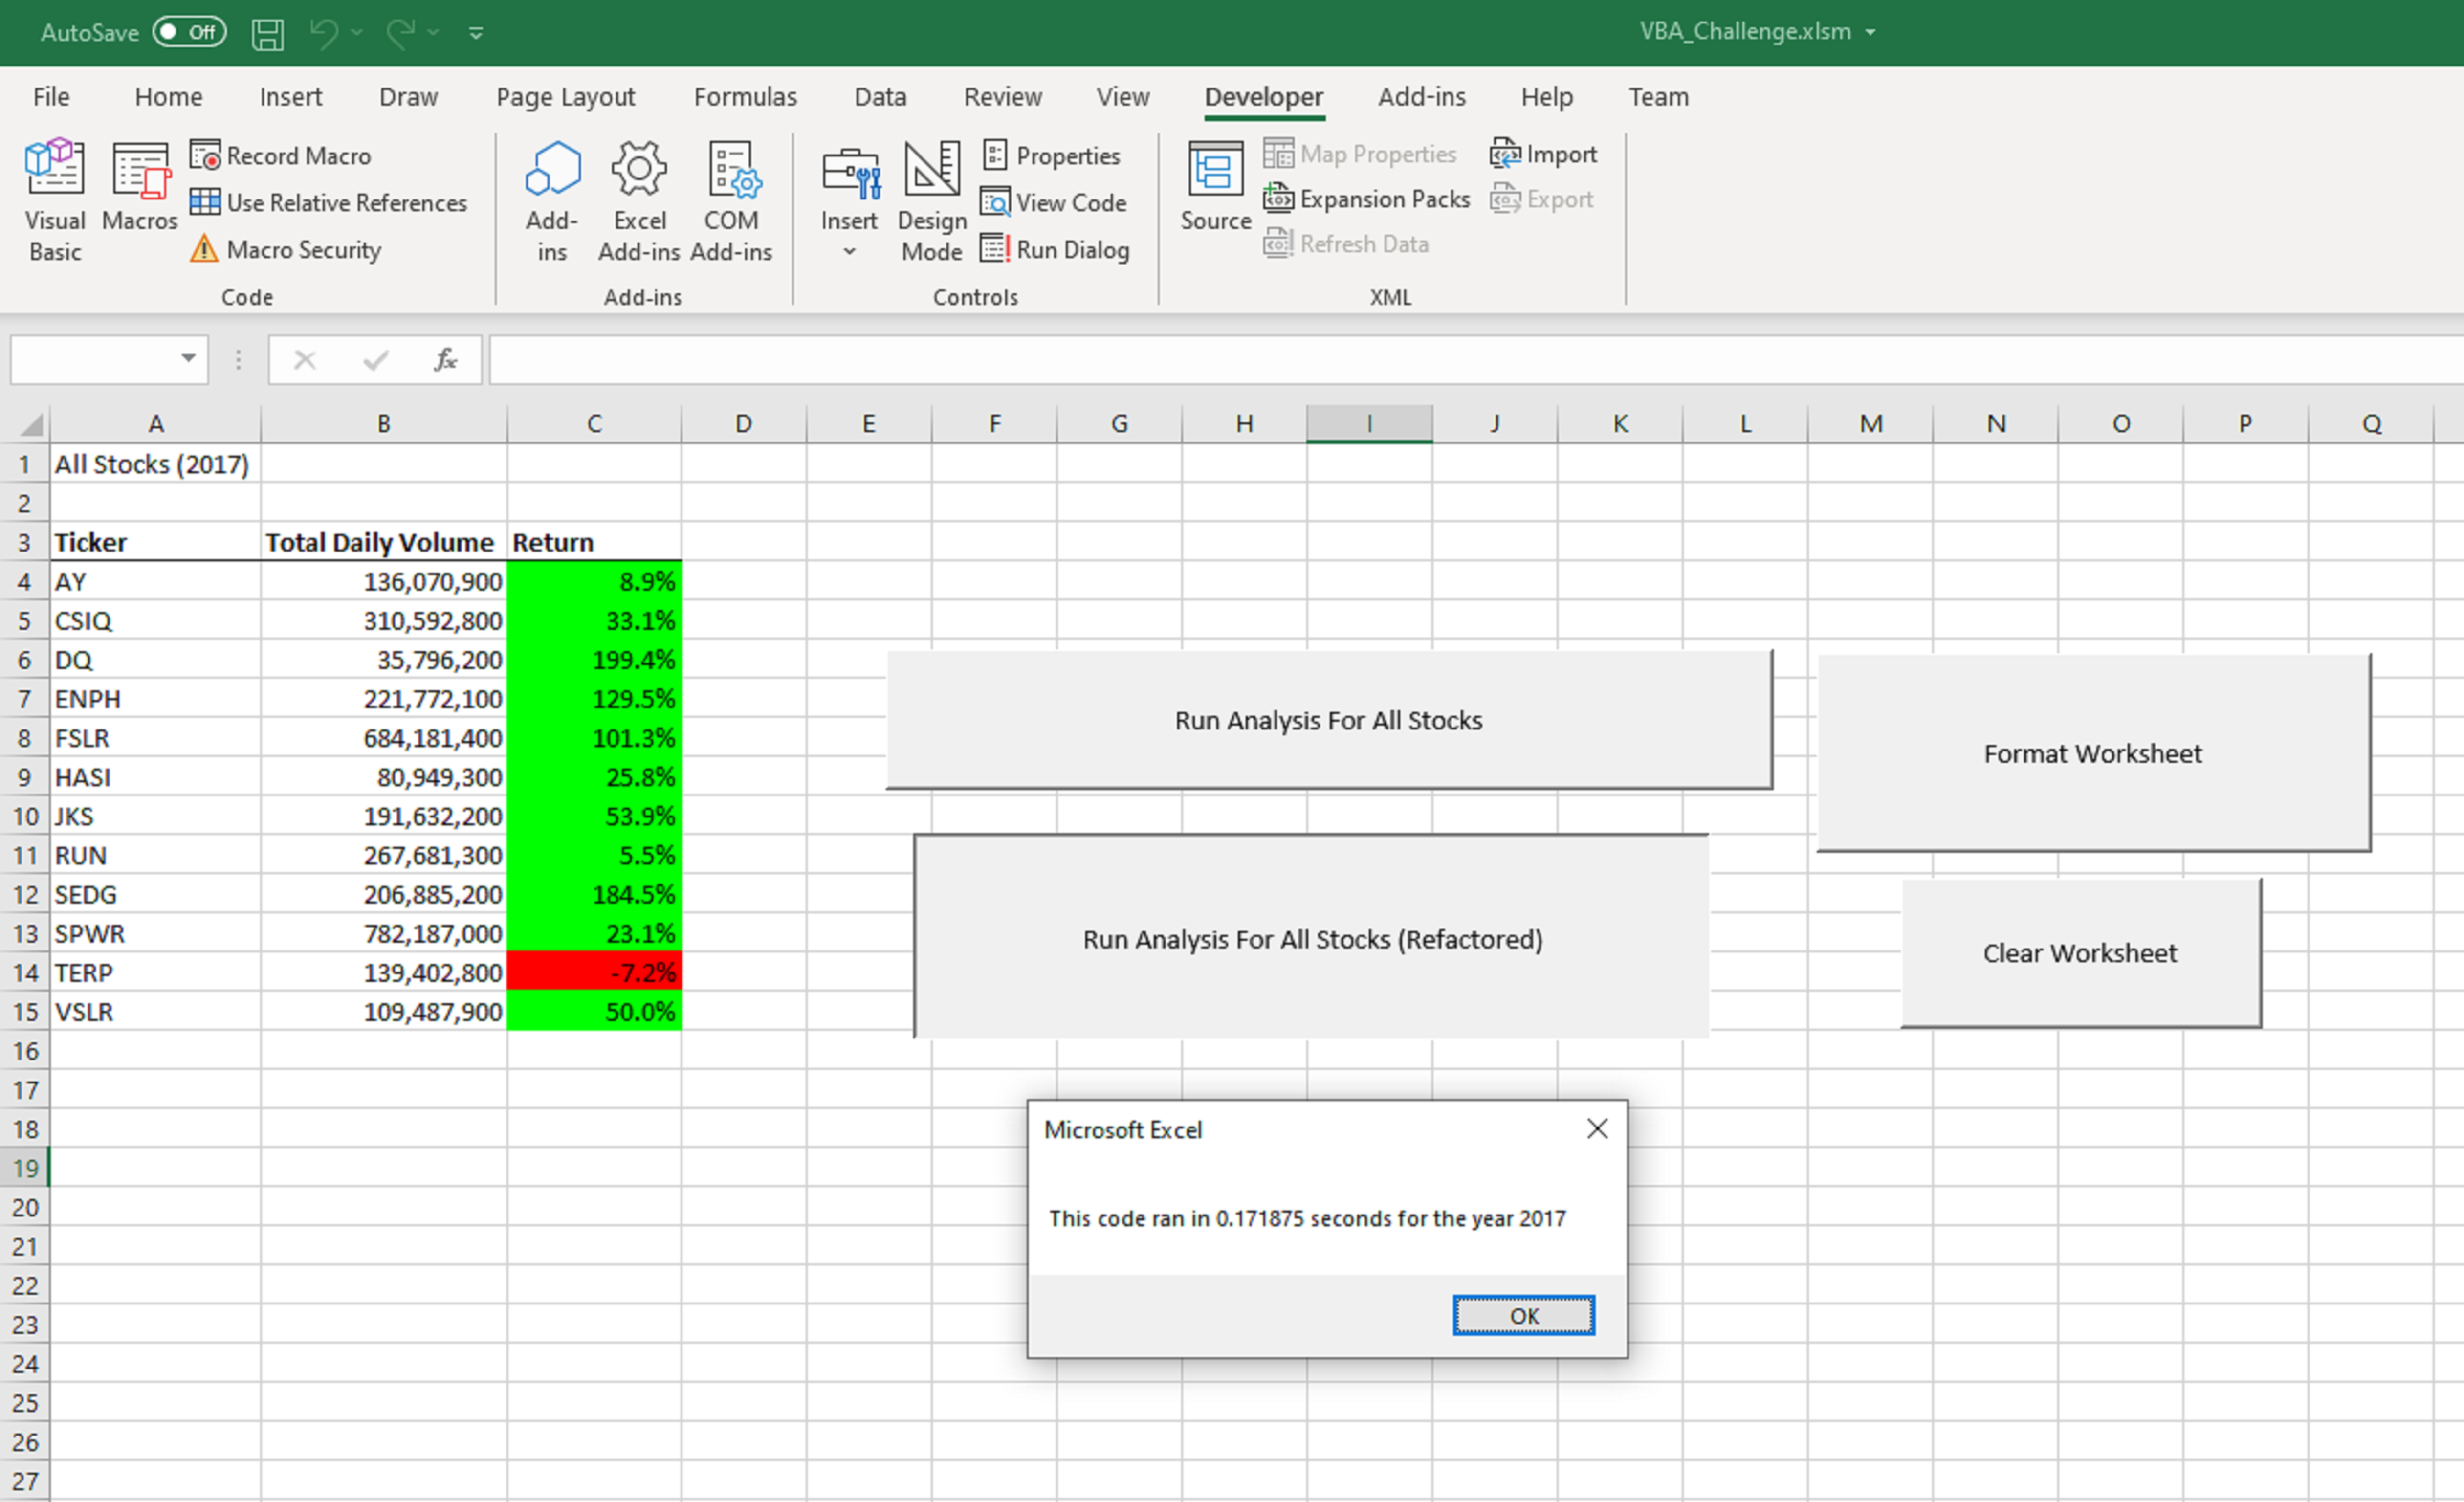
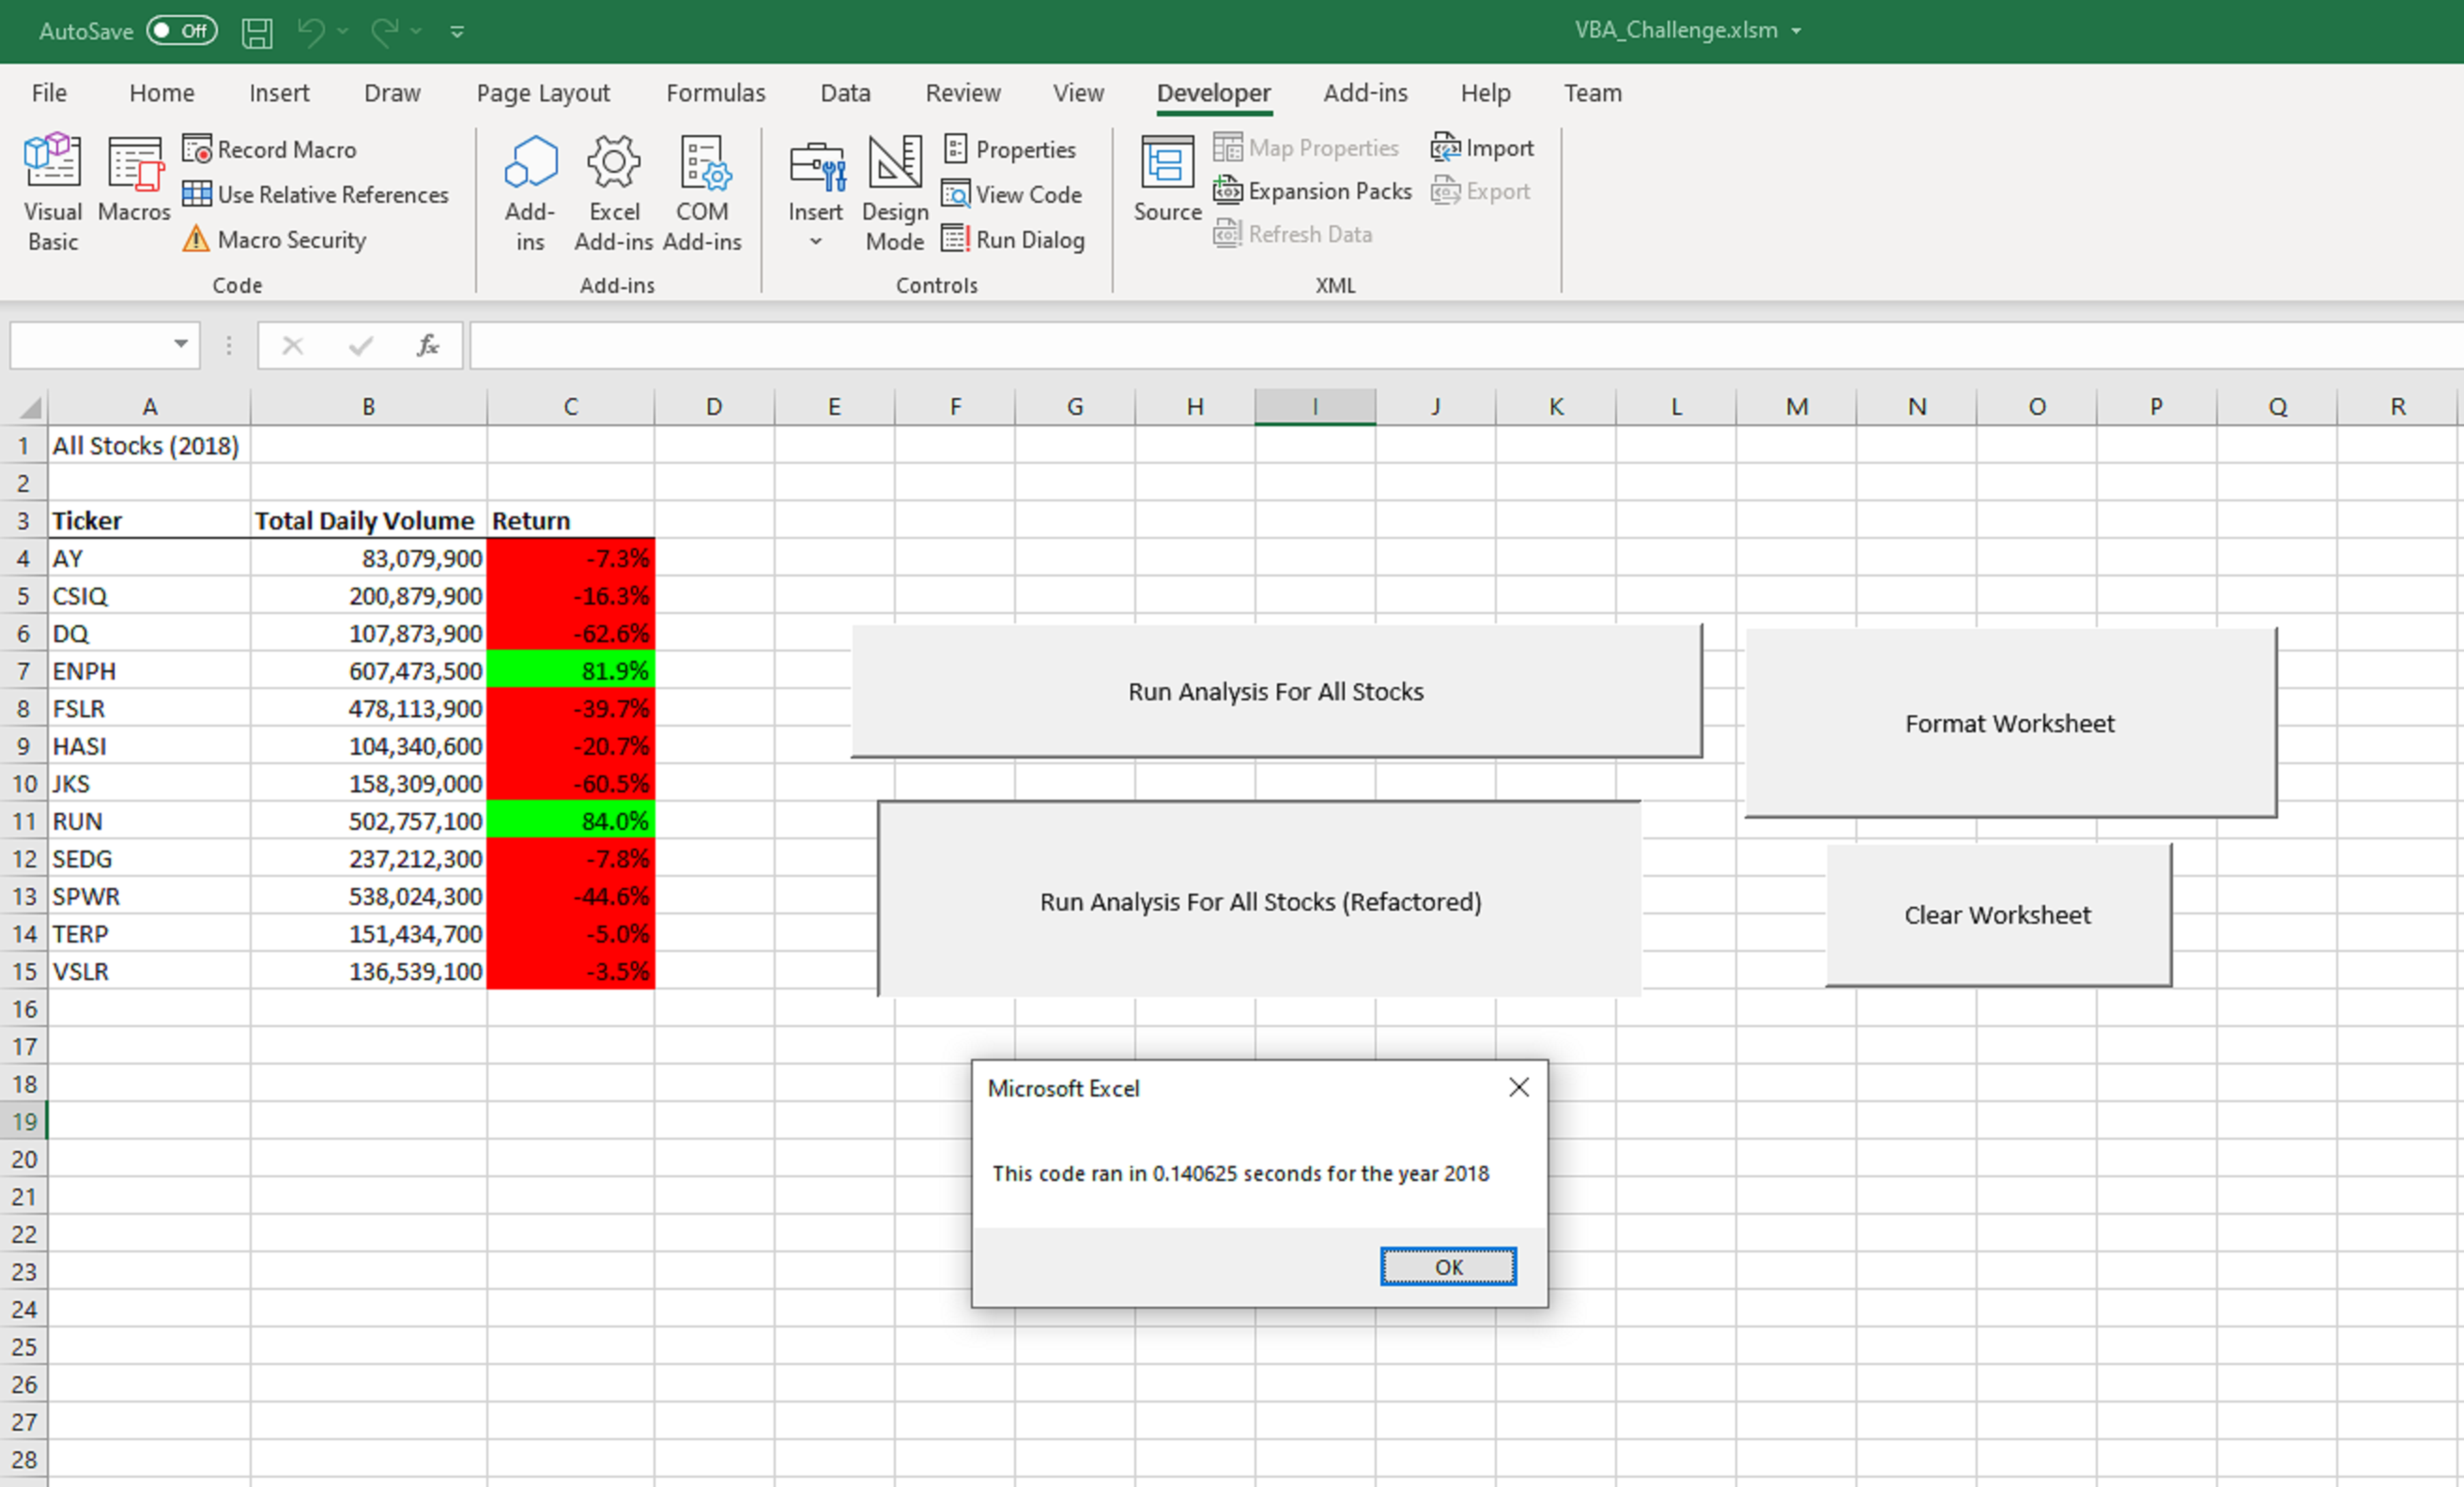
The stock analysis macro that was written looped through the entire worksheet, updating row by row, and columm by column within Excel which reulted in a run-time of 0.66~ seconds for 2017 and 2018. Macro run-times introduced the topic of code refactoring. Using multiple output arrays, we were able to rewrite the original stock analysis macro into a refactored stock analysis macro that ran much more efficiently. Refactoring code is especially important for future analyses that may include exponentially more data. Ticker volumes added together for every trading day in the year, ticker starting prices (closing price) for each ticker at the beginning of the year, and ticker ending prices (closing price) for each ticker at the end of the year, were stored in arrays and then outputted to appropriate cells which made the macro run significantly faster when values were assigned memory addresses in RAM. In the below images under the Resources header, we can see the stock analysis macro code run-time differences between the original and refactored code (decreased greatly to 0.17~ seconds for 2017 and 0.14~ seconds for 2018).
Below is a comparison of the original stock analysis macro code versus the refactored stock analysis macro code.
Below are images of the yearly stock performances of 12 stocks in 2017 and 2018 along with their original, not refactored runtimes.
2017
2018
Below are images of the yearly stock performances of 12 stocks in 2017 and 2018 along with their refactored runtimes.
2017
2018
From the provided images we can see that if you had invested in all 12 of the analyzed stocks at the beginning of 2017 you would find that 2017 was quite the year of yearly percent returns and 2018 was not so good, save TERP, which had a negative yearly return performance for both 2017 and 2018. ENPH and RUN were positive yearly return winners in both 2017 and 2018. Past stock performance does not predict nor guarantee future returns.
