PnAT is a set of tools to analyze and visualize Petri nets and and its reachability graph. It works well with Yasper, a modeling and simulation tool for Petri nets. The idea is that a user defines a Petri net model in Yasper and then uses PnAT in conjunction to analyze structural and behavioral properties.
Some properties such as open petri nets, leg and choice properties are specific to models describing communicating component-based system. In such systems, components provide and consume services over interfaces. An interface is more than just a list of events, its behavior is defined in terms of a class of Petri nets called portnets. A component is also a Petri net obtained by refinements with provided and required portnets. Such kind of constructs can be modeled in Yasper using the subnet feature and interpreting reference places as interface places of a component.

Beware that subnets more than one level deep are uninterpreted. Also ensure that all places, transitions and nets have labels.
- Reachability Analysis of Communication Protocols
When you download PnAT, you will find two executable JAR files
-
LaunchPetriNetAnalysis.jar
- Input: Accepts a Petri net model in PNML format
- Tested so far against modeling tools such as
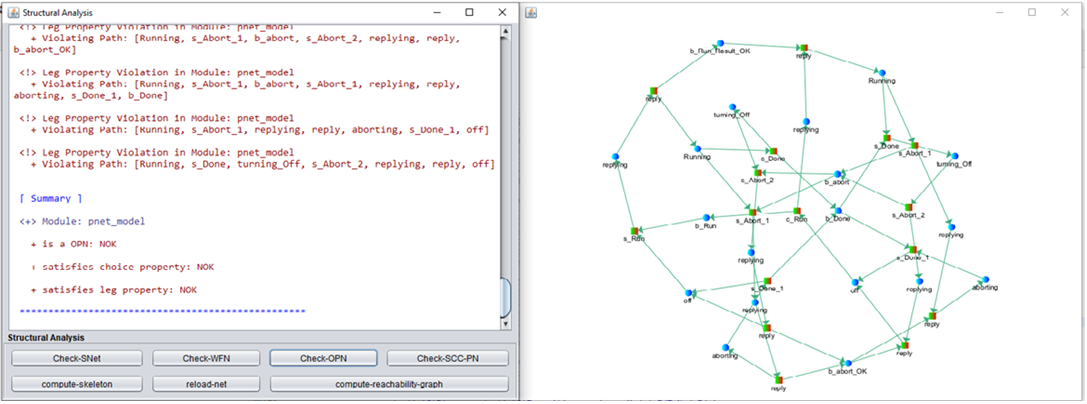
- Analysis Options
- state machine net
- workflow net
- open petri net
- choice and leg properties
- Generator Options
- reachability graph (with bounds on number of steps)
- coverability graph
- skeleton
- Others
- reload-file
-
LaunchReachabilityGraphAnalysis.jar
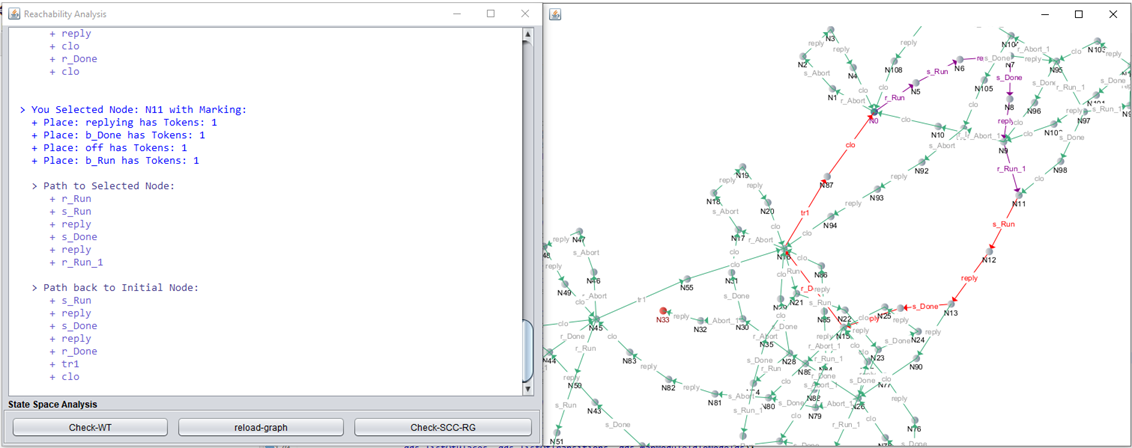
- Input: Accepts a reachability graph file in DGS format (generated by LaunchPetriNetAnalysis.jar)
- Analysis Options
- Weak termination
- strongly connected components
- path finder: select a node in the visualization to see its marking and visualize a set of paths from the initial node and back to it
- Other
- reload file


- Debjyoti Bera, The Netherlands
For suggestions or questions you can mail me at [email protected]
See the LICENSE file for license rights and limitations (GNU LGPL v2.1).