An application for producing star charts and animations using data from the ESA's Gaia project.
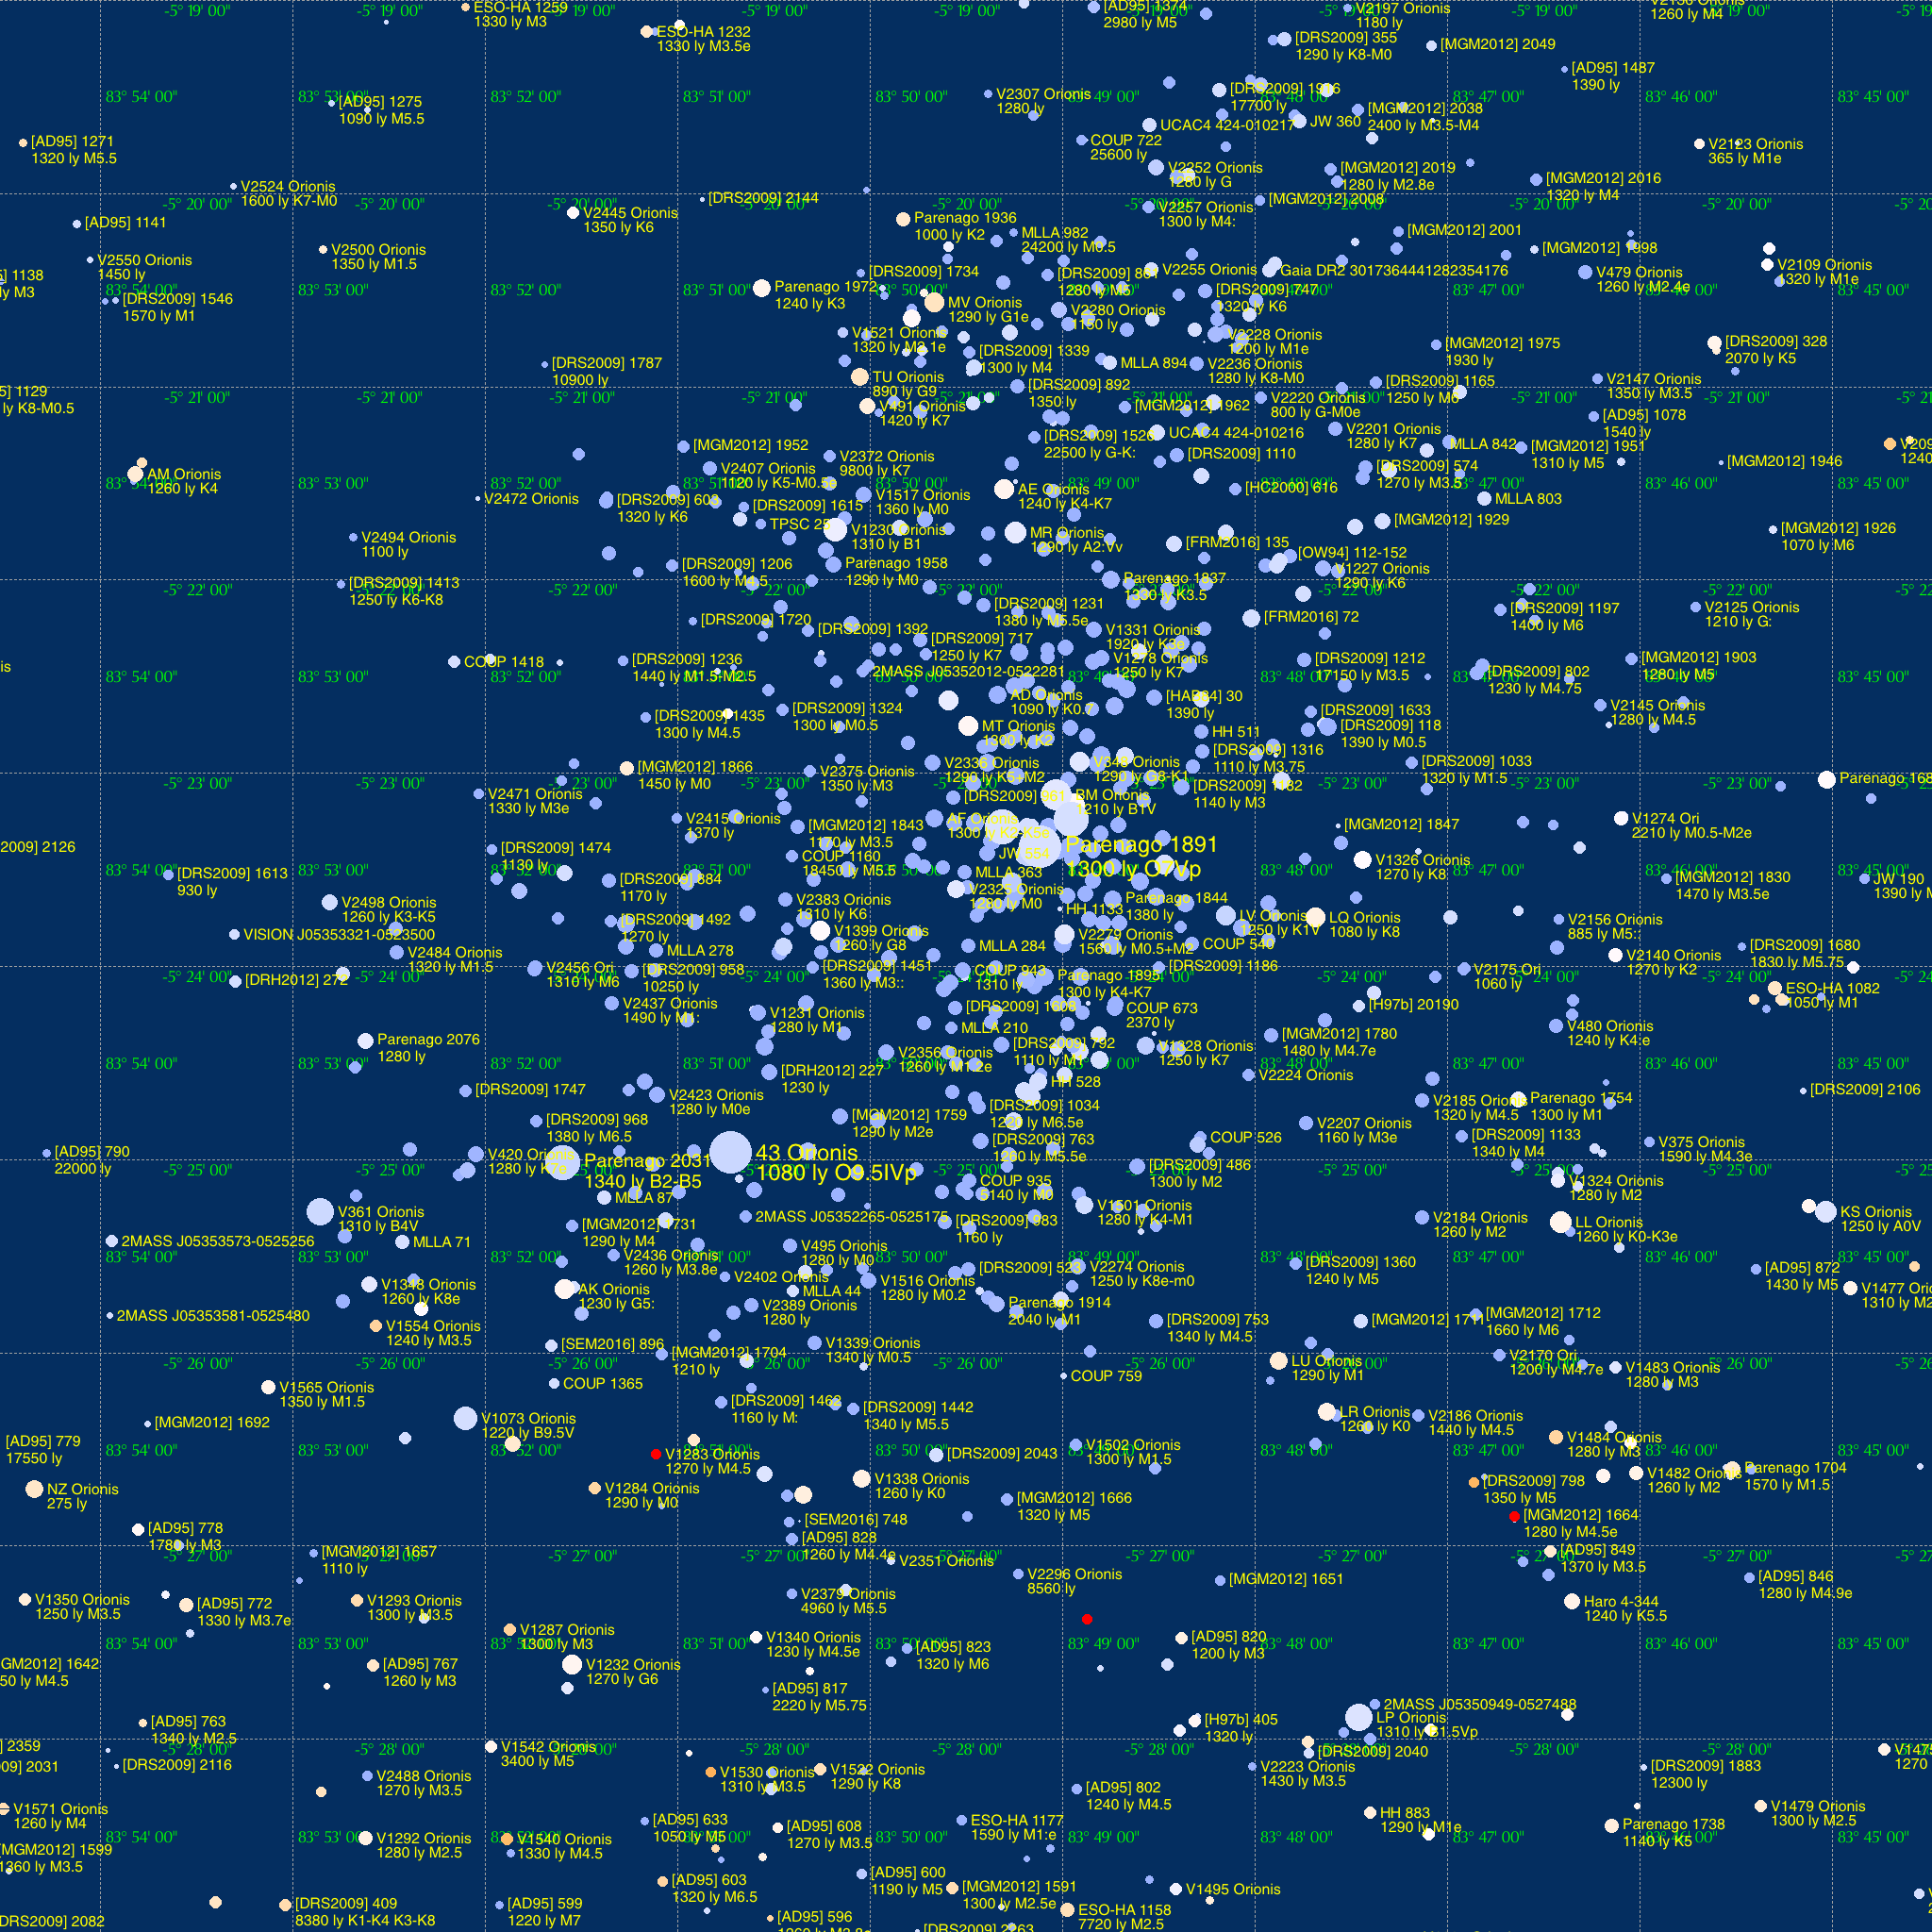
Orion's sword: The result of the command
./gaiamap -object "Orion's sword" -radius 5 -dist -h 2048
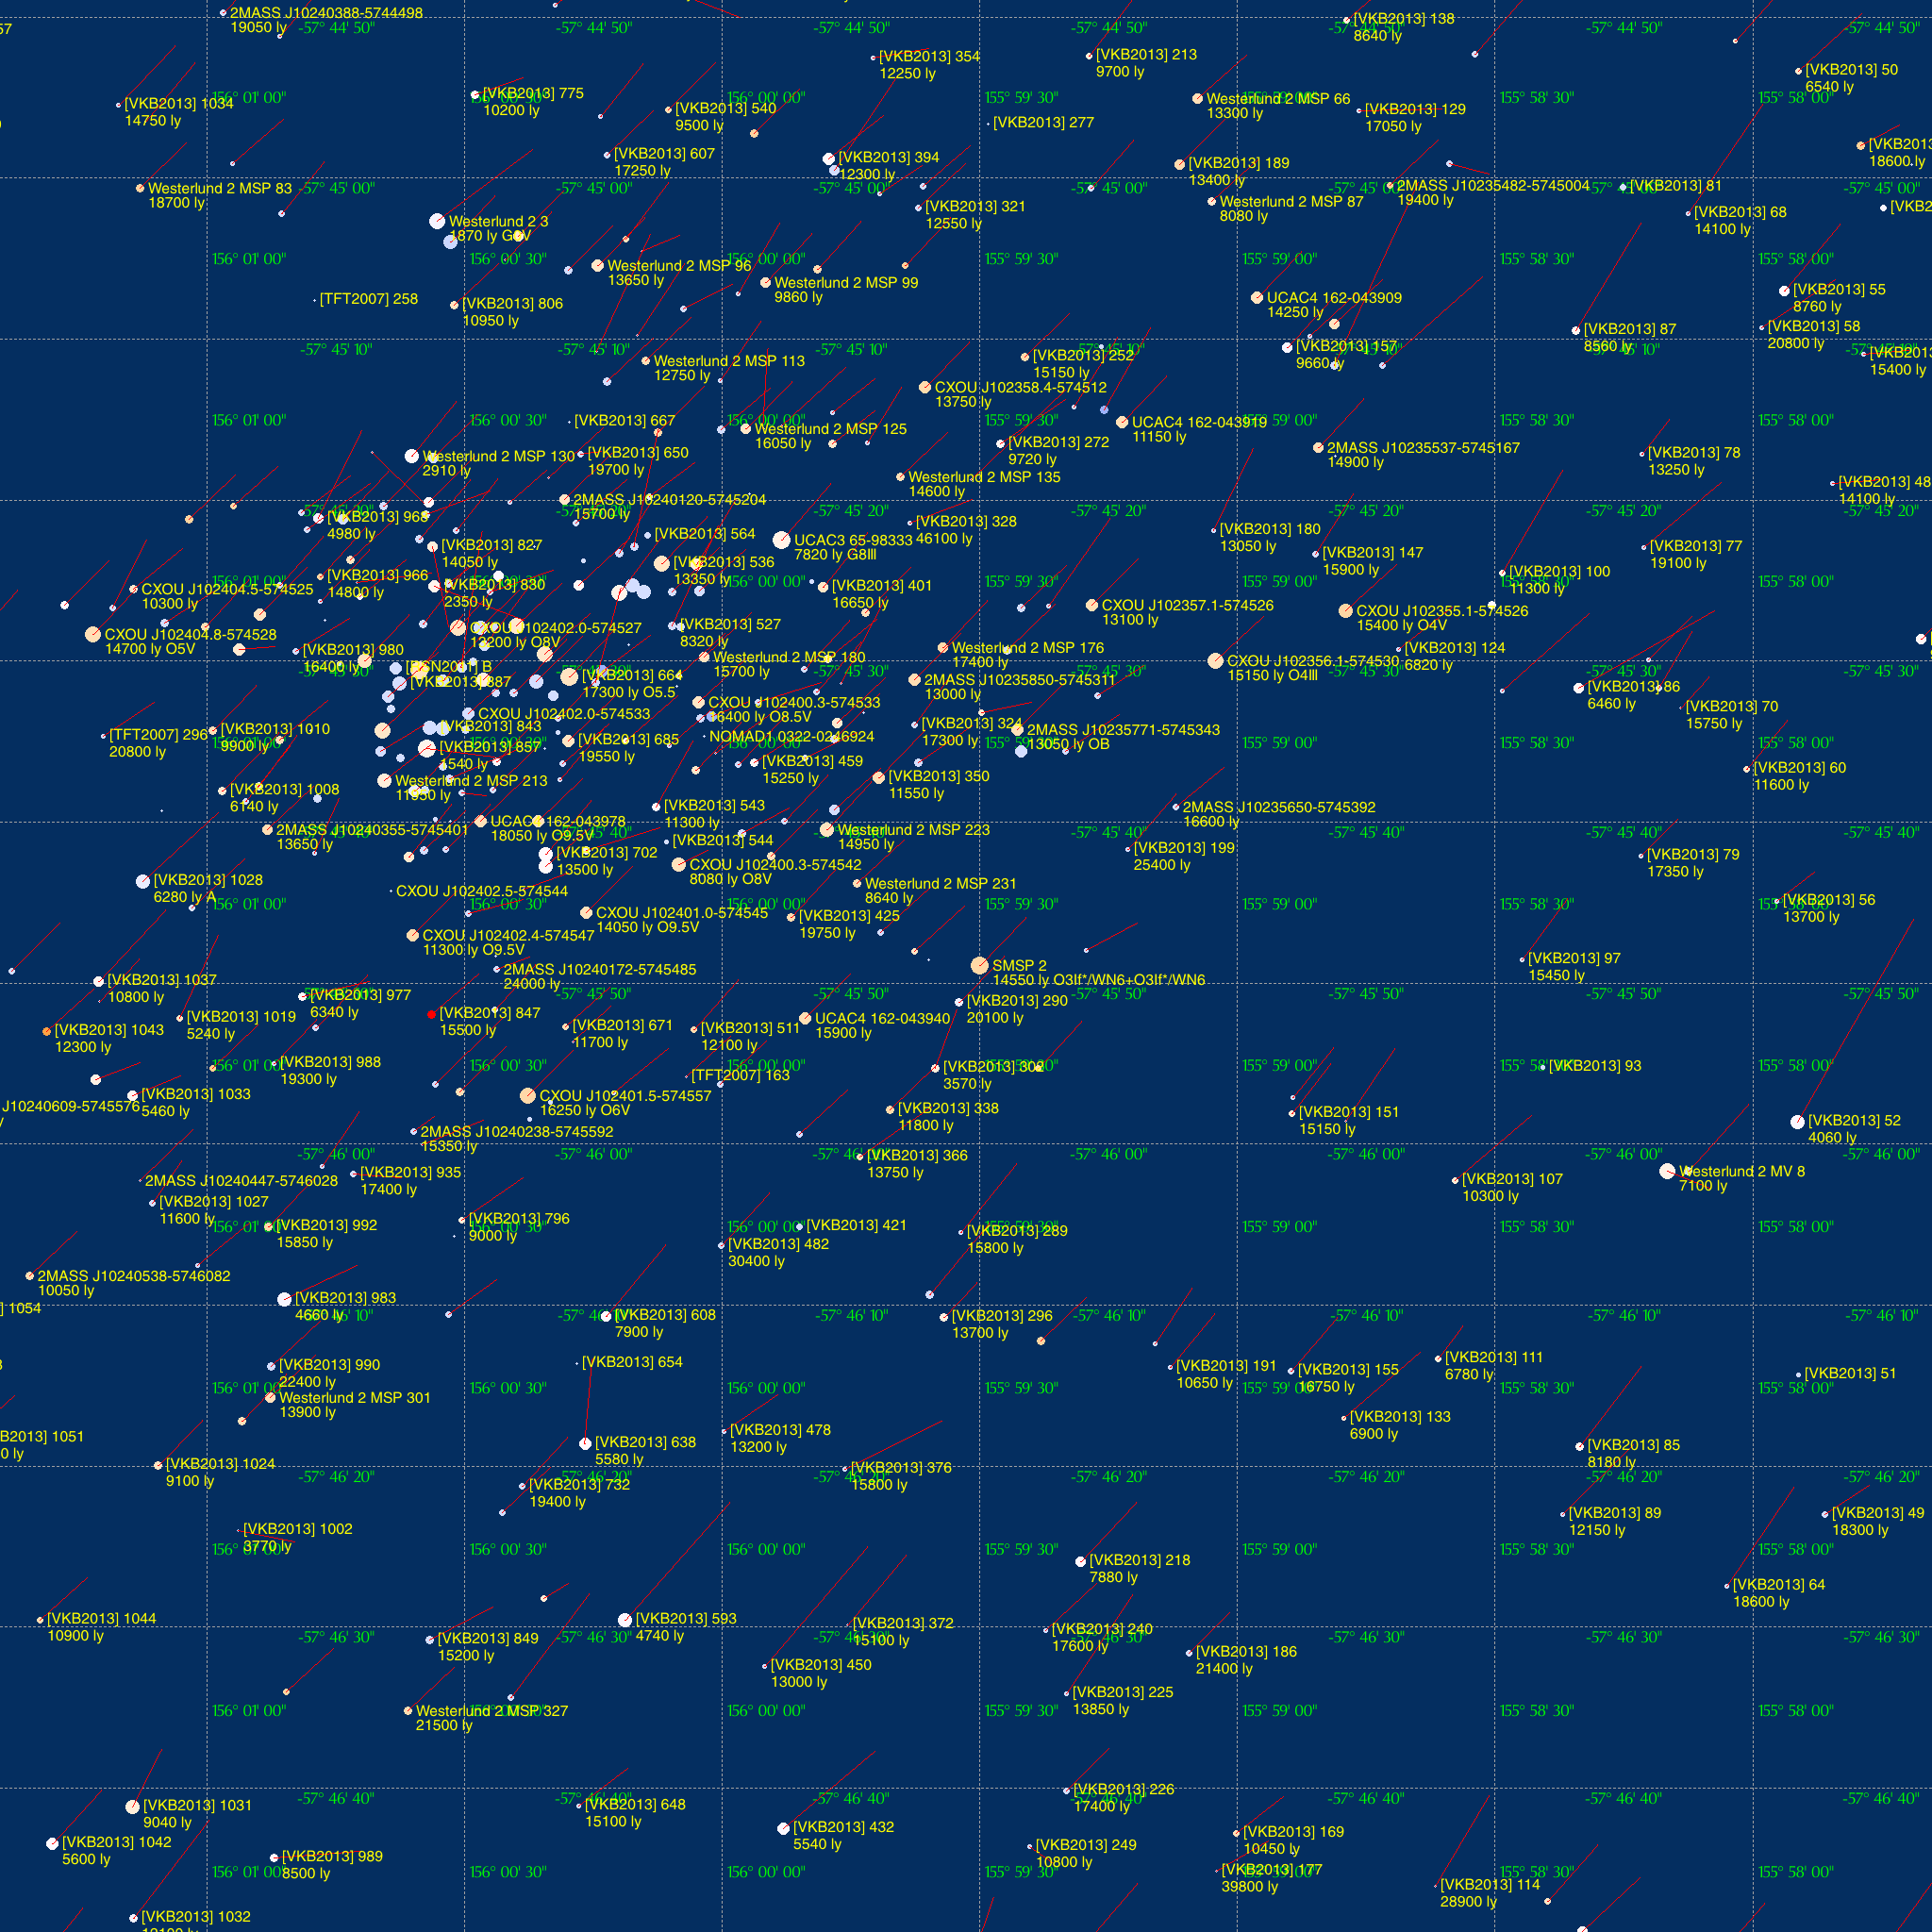
Westerlund 2: A plot of a star cluster with proper motion arrows
./gaiamap -object "Westerlund 2" -radius 1 -dist -h 2048 -pm
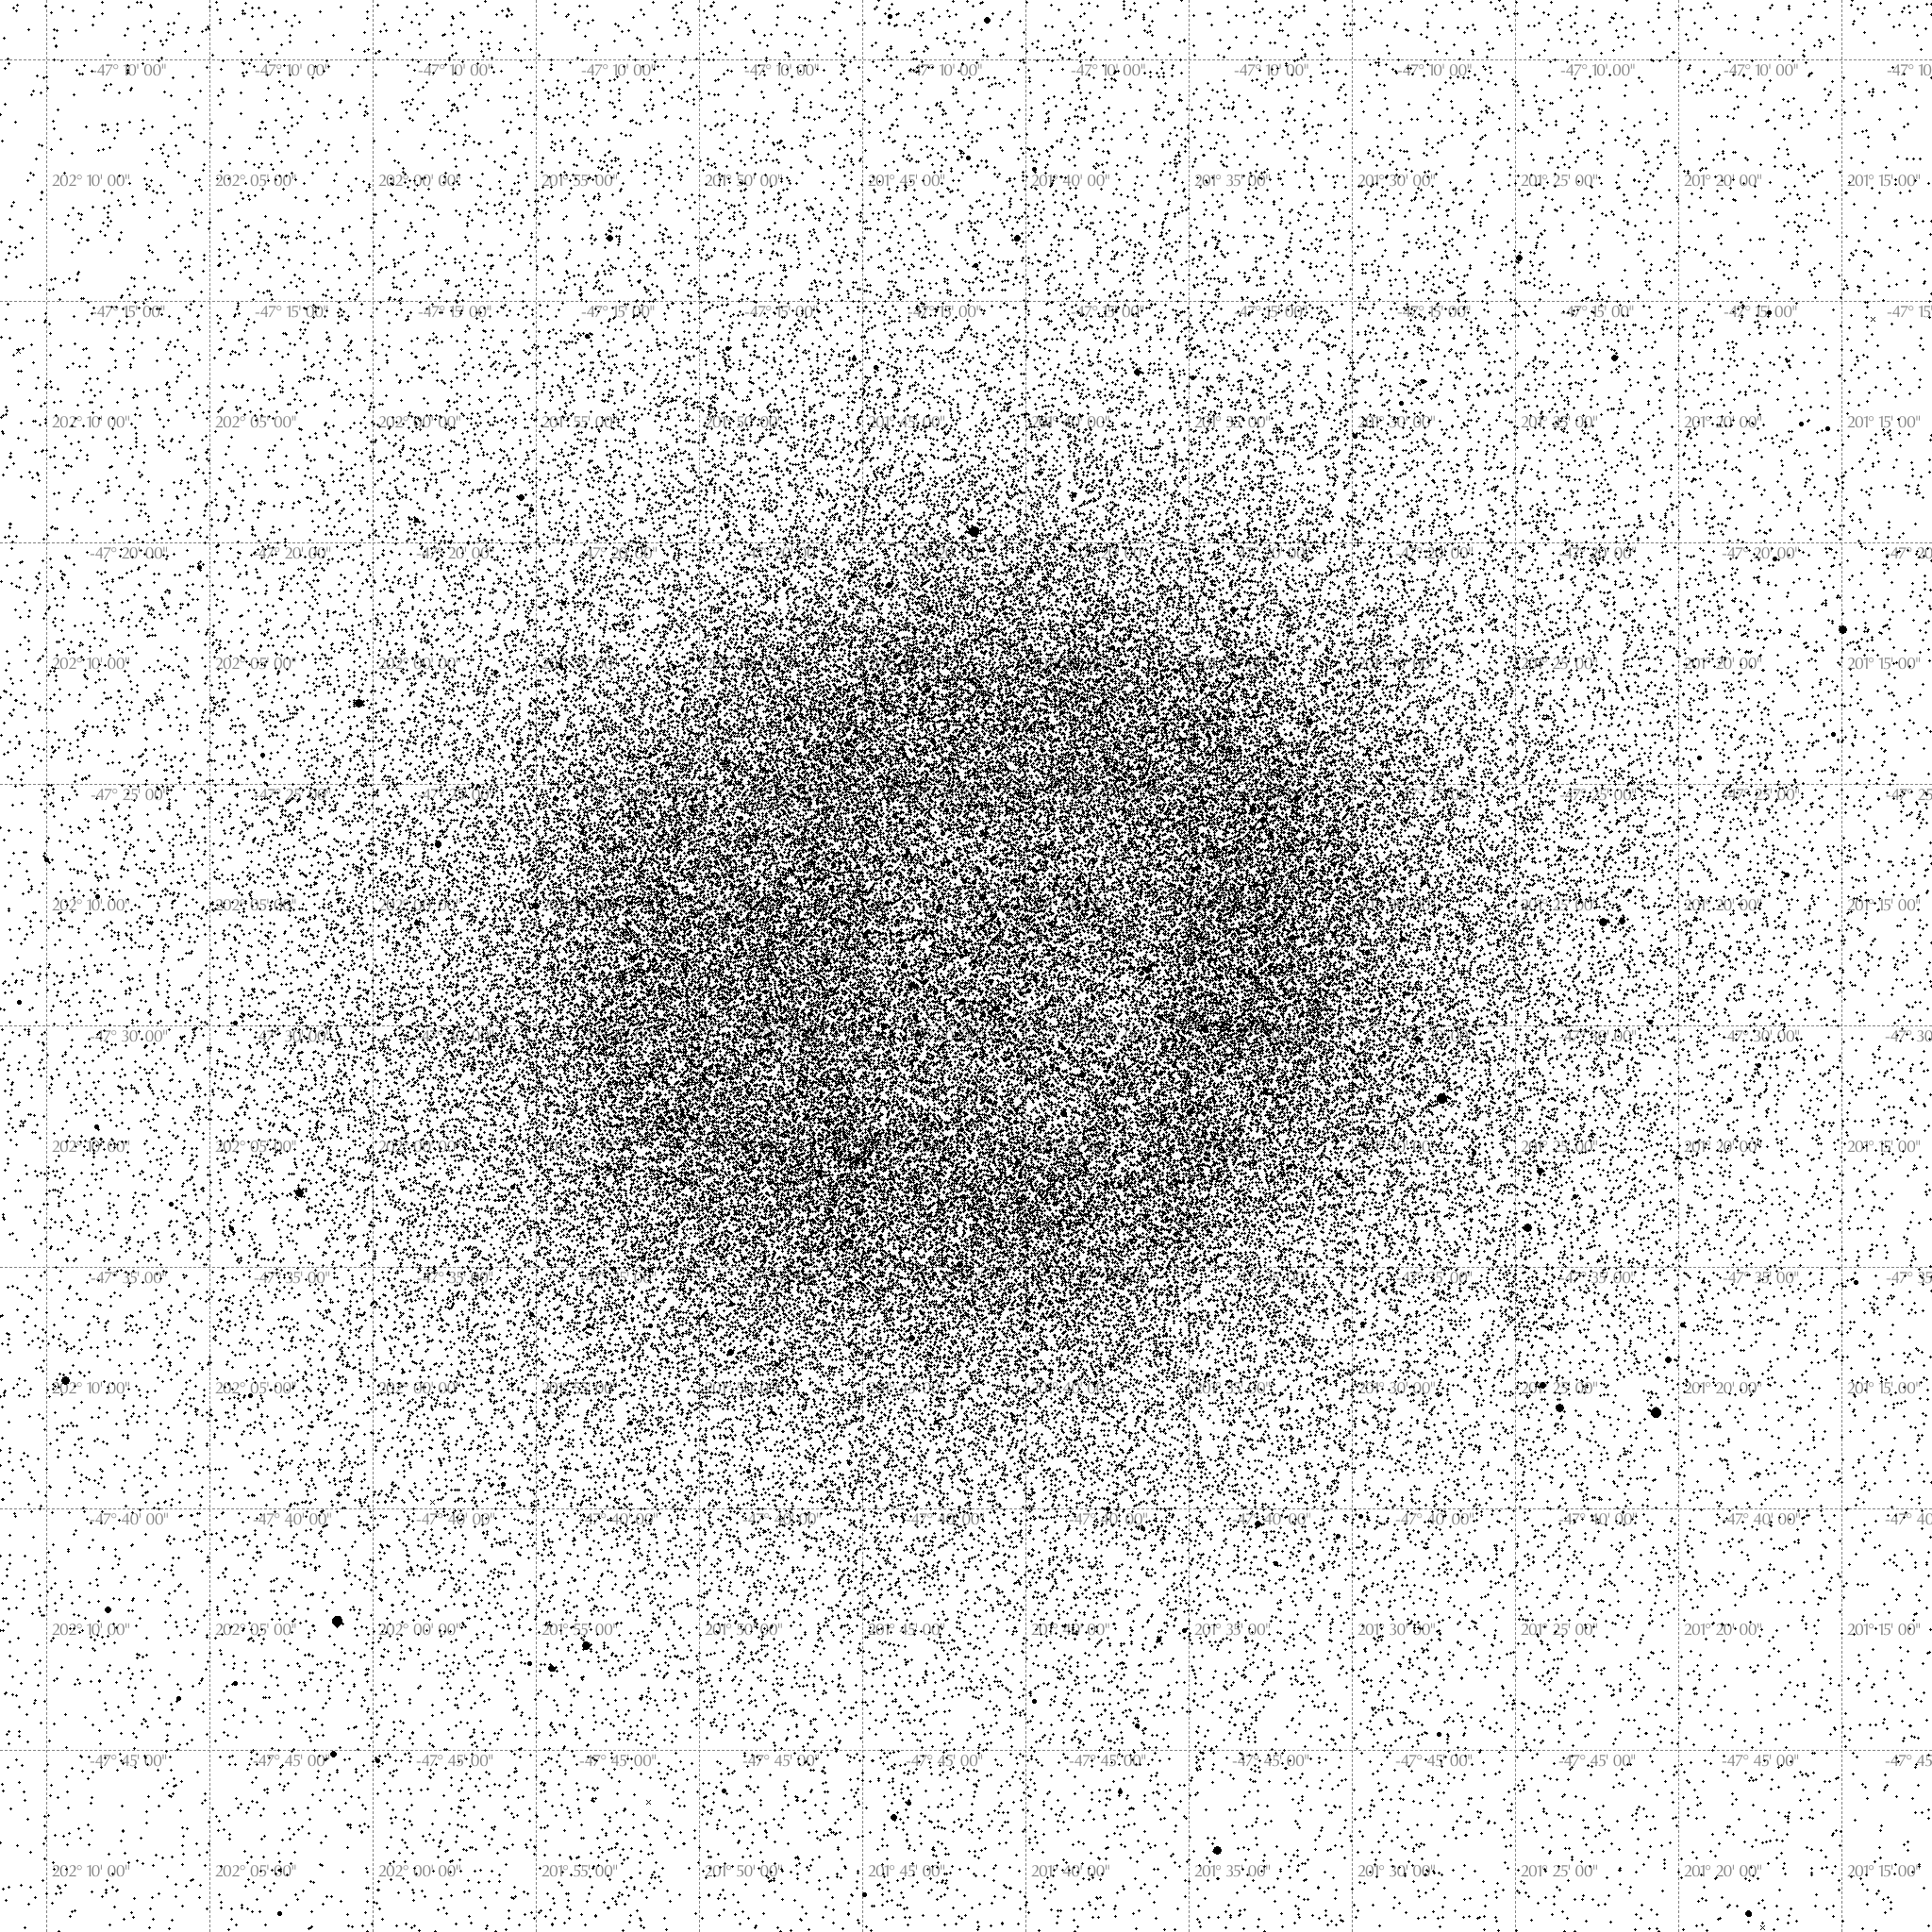
Globular cluster: A plot of Omega Centauri, in printable colors
./gaiamap -object "Omega Centauri" -neg -radius 20 -small -nonames -h 2048
Zoom animation:
This animation into 30 Dor in the Large Magellanic Cloud
The application uses Gaia DR3 data that has been extracted and cross-referenced with other astronomical catalogs and databases to provide additional information about sources, such as spectral type, distance estimates from Bailer-Jones 2021, or alternate designations. The data can be downloaded from the codehappy.net website here. The full-sky dataset is ~34 GB compressed and over 120 GB uncompressed; if you are only interested in certain portions of the sky, you may download only the declination ranges that you require.
Uncompress the downloaded data into a folder named degrees/; this folder should be in the same directory as the gaiamap executable.
This app depends on libcodehappy. It has no other non-stdlib dependencies. The make.sh script shows an example build (just point g++ to the correct folders for your includes/library archive file.)
Maps are output to a file named output.png.
-dec: declination (defines the range or center DEC for the plot)
Usage notes: Declination may be written in decimal degrees form or in degrees/arcminutes/arcsesconds form: for example 30.61 and 30d36m36s refer to the same DEC value. You can give a single value for -dec and use the -radius option to define the valid coordinate range, or you can give two right ascension values separated by a comma, e.g. -14.15,-13.85. See also -ra for right ascension (range) and -object for aiming the plot at the named object.
-dist: render distance estimates and spectral types for sources on the plot.
-h: the height of the output map in pixels.
Usage notes: See -w for width.
-mag: specify a limiting magnitude for the plot.
Usage notes: This takes one argument, the dimmest permissable magnitude for objects in the plot.
-neg: Draw the chart in negative (printable) colors.
Usage notes: You probably want this if you intend to print the chart; dark stars on light background are easier to read and use less toner on printers.
-object: center the plot on the location of a pre-defined object.
Usage notes: Use with the option -radius. Over 12,000 star, cluster, nebulae, star-forming regions, and galaxies have their RA/DEC defined in xmatch/locations.csv; this is the file that the application searches to find the correct location. You can add or remove objects from this list as you please, just follow the format <name>,<RA decimal>,<DEC decimal>.
-pm: draw proper motion arrows on the chart for sources with PM data available.
Usage notes: By default, the arrow ends where the source is predicted to appear 1,000 years from now. To use a different scale, see the option -pmy.
-ra: right ascension (define the range or center RA for the plot)
Usage notes: Right ascension may be written in decimal degrees form, in hours/minutes/seconds form, or in degrees/arcminutes/arcseconds: for example, 30.61, 2h36m36s, 2:36:36, and 30d36m36s refer to the same RA value. You can give a single value for -ra and use the -radius option to define the valid coordinate range, or you can give two right ascension values separated by a comma, e.g. 13.85,14.15. See also -dec for declination (range) and -object for aiming the plot at the named object.
NB: by default, the right ascension range may be adjusted to fit the aspect ratio of the chart. Use the option -fixra to, instead, adjust the width of the chart to fit the RA range.
-radius: gives the desired radius of the plot
Usage notes: Use this option if you're giving an RA/DEC point (instead of range), or are specifying a central object with -object. The single argument is the desired radius in arcminutes.
-small: draws the stars in the plot using smaller circles.
Usage notes: this gives a less-cluttered plot in densely populated parts of the sky.
-w: the width of the output map in pixels.
Usage notes: See -h for height.
-zoom: render a series of frames representing a "zoom in" on the specified location.
Usage notes: Each successive frame reduces the plot radius by 1%, and continues until the radius is <1 arc-second. The images are output to files with the name frame000000.png, frame000001.png, etc.
-close: only plot objects estimated to be this close or closer
Usage notes: Takes one argument: the maximum distance in light years.
-dark: set the background color to black, instead of navy blue.
-decadj: the declination value to use as the base for non-rectangular projection
Usage notes: At very high or very low declination, or in charts with extermely large radii, rectangular projections give distorted plots. This option specifies a base DEC value to use in scaling.
-dim: this option dims the colors of more distant sources.
-far: only plot objects estimated to be this far or farther
Usage notes: Takes one argument: the minimum distance in light years.
-fixra: keep the right ascension range fixed, and change the plot's aspect ratio to fit instead.
-nocone: suppress the output of the cone_map.csv file.
Usage notes: By default, all objects in the plot (along with other information such as magnitude, distance, spectral type, etc.) are output to a comma-separated file named cone_map.csv.
-nomap: suppresses the output of the plot.
Usage notes: Use if you just want the cone_map.csv file.
-nonames: suppress the rendering of object names in the plot.
-pmy: specify the number of years of proper motion to plot on the chart.
-rect: use a purely rectagonal projection to create the plot.
-short: when rendering names on the plot, always use the shortest known designation for a source.
-simbad: render SIMBAD designations with prefixes, e.g. "Cl*", as-is.
-tic: suppress the output of designations from the TESS Input Catalog.


