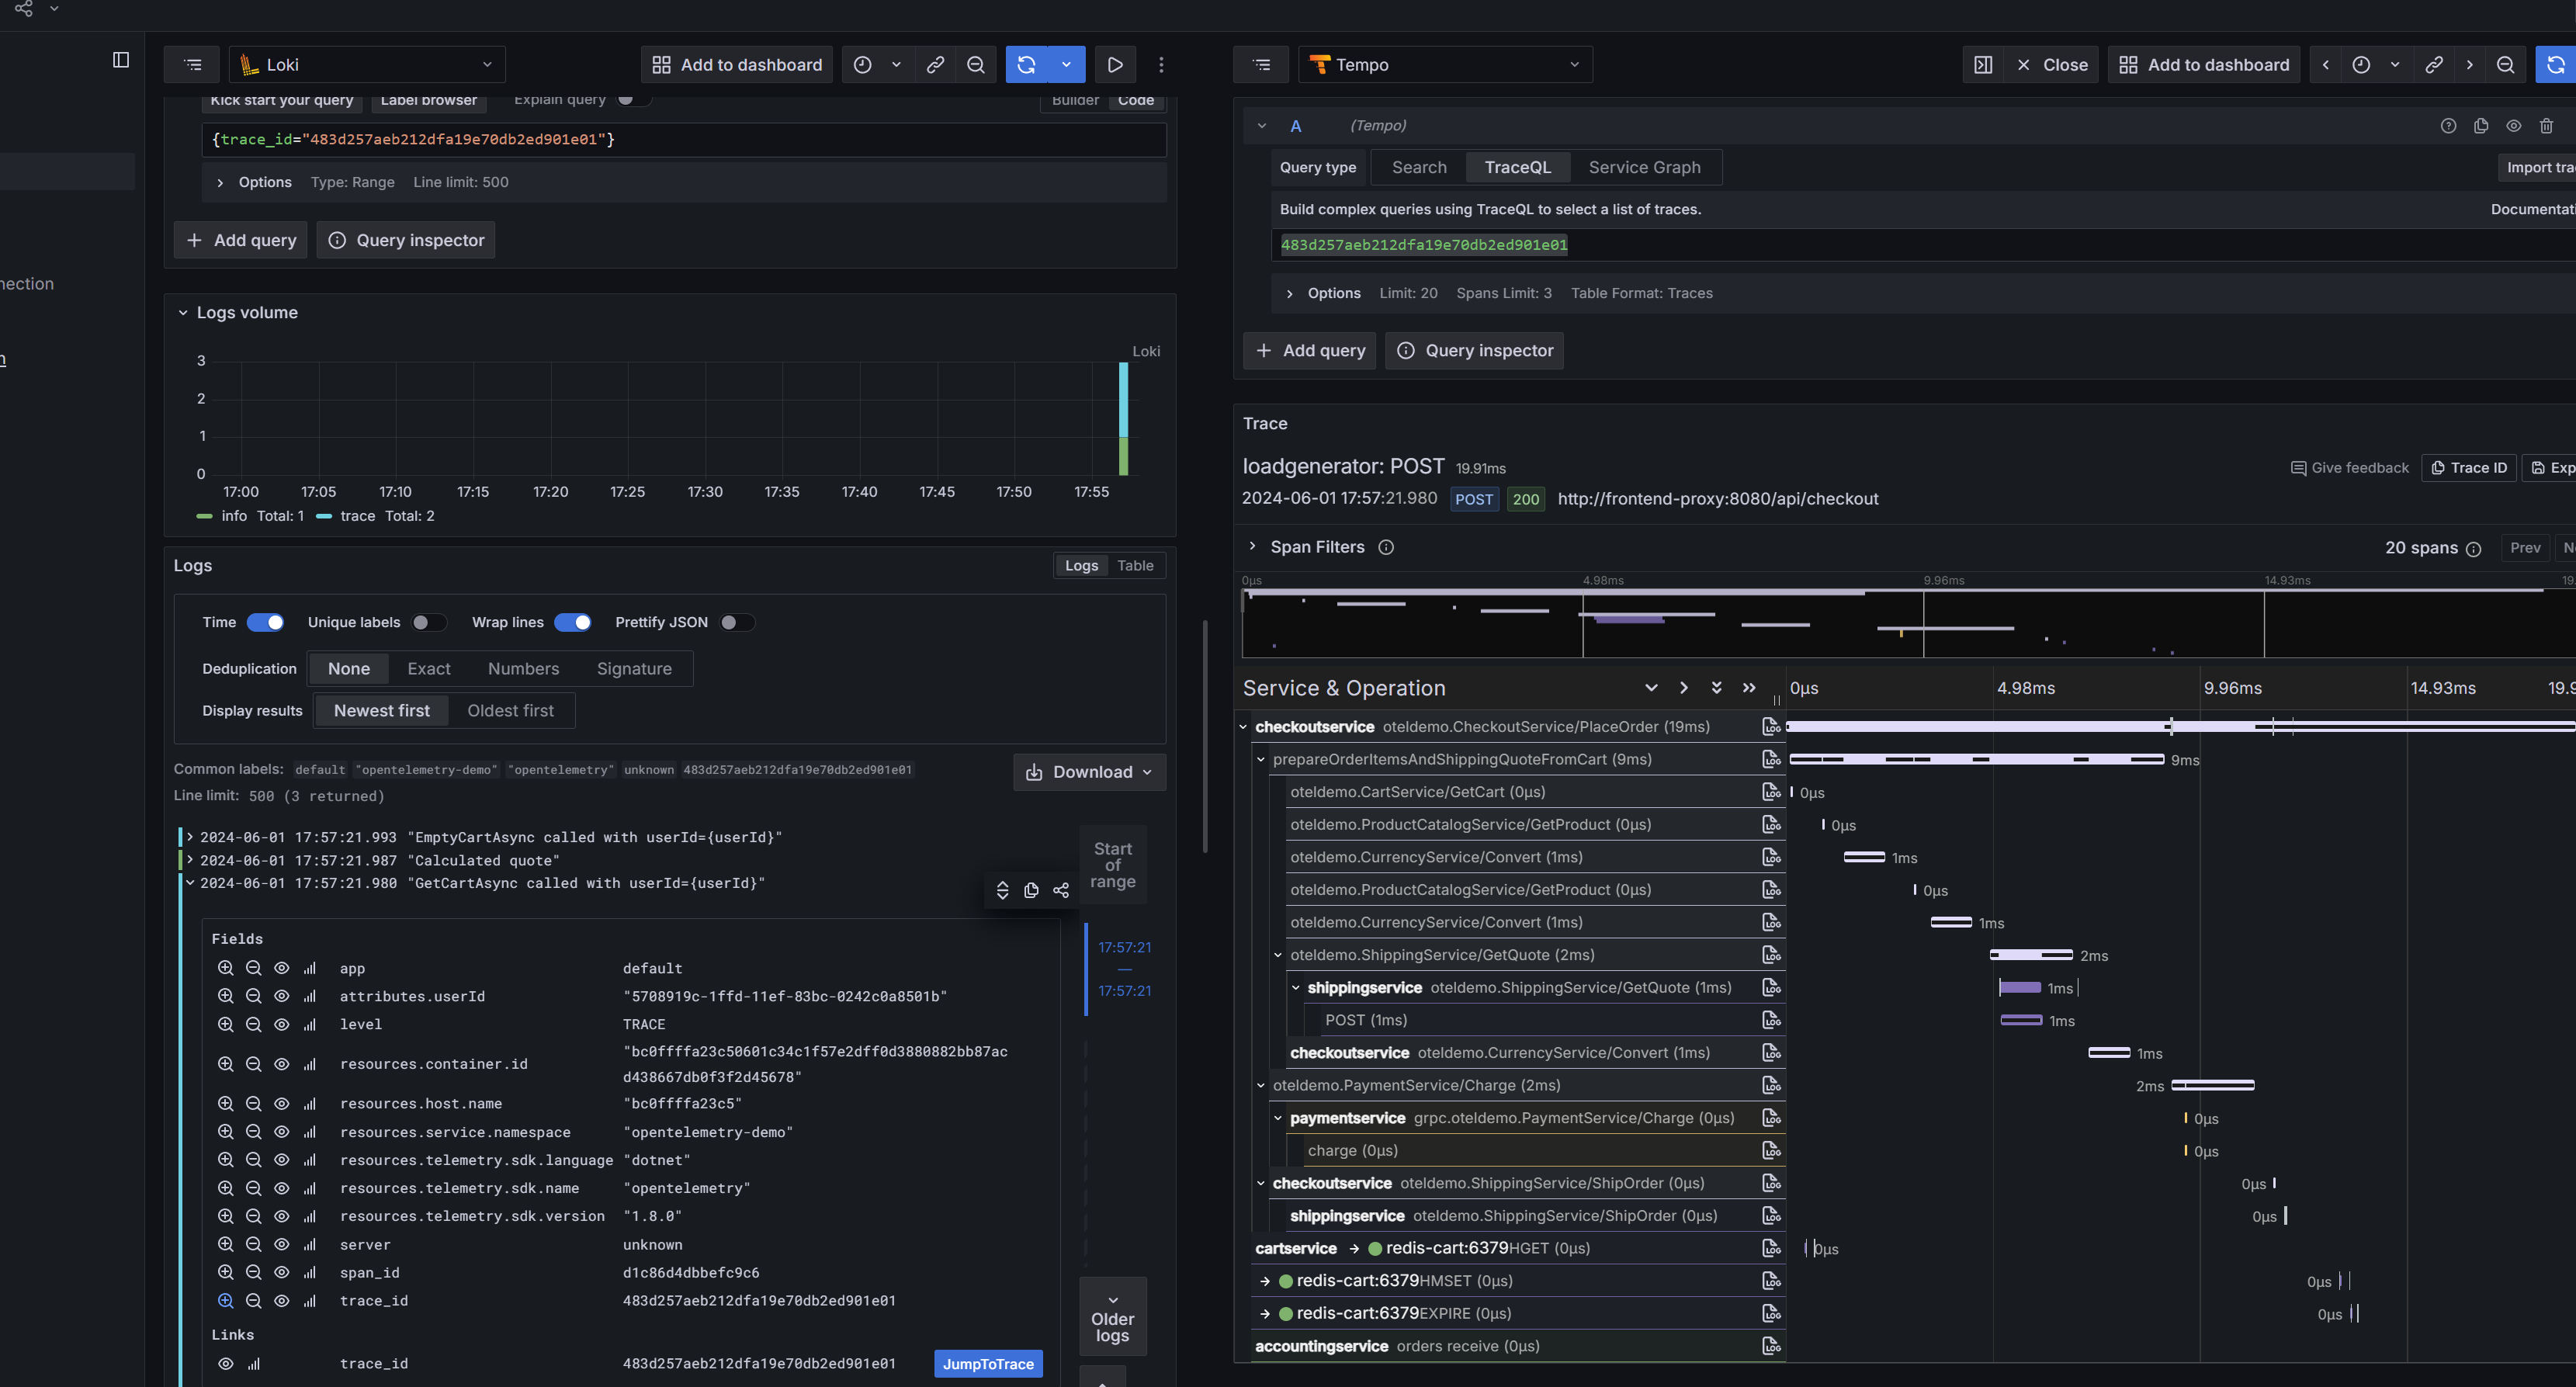
Grafana Loki and Tempo are excellent tools for log and trace management, providing significant cost savings and data reliability through object storage. However, they often fall short in terms of performance. While there are many log solutions available in the market that handle writing, storing, and querying logs, most of them do not include a user-friendly UI. Developing a good user interface is a complex task. This project aims to leverage the strengths of Grafana to offer more options for observability systems.
This project, named ltbridge, implements the HTTP interfaces of Grafana Loki and Tempo. The "l" stands for both "log" and "Loki," while the "t" stands for both "trace" and "Tempo." The term "bridge" signifies its role as a bridge, converting different data sources into the Loki and Tempo formats. ltbridge allows you to add Loki and Tempo as data sources in Grafana, providing services as if they were native Loki or Tempo instances. Internally, it parses LogQL and TraceQL queries, converts them into equivalent SQL or other DSLs, queries the corresponding systems for data, and then transforms the data back into the Loki or Tempo format.
- Leverages Grafana's Loki and Tempo Plugins: By standing on the shoulders of giants, this project maximizes the use of Grafana's existing Loki and Tempo plugins.
- Provides an Abstraction Layer: This intermediate abstraction layer allows users to switch to their preferred observability infrastructure seamlessly without significant changes.
This project is under active development, don't use it in production for now(we're using it in prod)
- Clickhouse Storage: Implemented and functional, but requires polishing.
- Databend Storage: Implemented and functional, but requires polishing.
- Quickwit Storage: Implemented and functional, but requires polishing.
- Add more detailed step-by-step documentation for running the project.
- Integrate GitHub Actions for automated PR checks, nightly builds, and dependency updates.
- Improve the current functionalities in Databend and Quickwit, focusing on intelligent completion of index keys and key values.
- Make it GA
- Language: The project is developed using Rust.
# Install Rust
curl --proto '=https' --tlsv1.2 -sSf https://sh.rustup.rs | sh

# Install Cross-rs
cargo install crosscross build --target x86_64-unknown-linux-gnu- Databend Environment: Includes MinIO, Databend, Grafana, and pre-configured Loki and Tempo data sources in Grafana
- Quickwit Environment: Includes MinIO, Quickwit, Postgres, Opentelemetry-Collector, Grafana, and pre-configured Loki and Tempo data sources in Grafana
try databend
cd devenv/databend
docker compose up --force-recreate --remove-orphans --detach
try quickwit
cd devenv/quickwit
git submodule update --init --recursive
cd opentelemetry-demo
docker compose up --force-recreate --remove-orphans --detachIf you're trying quickwit, see this, or jump to the databend section
docker-compose has already done that
create config.yaml:
server:
  listen_addr: 0.0.0.0:6778
  timeout: 30s
  log:
    level: info
    file: info.log
    # for more details about filter_directives
    # see: https://docs.rs/tracing-subscriber/latest/tracing_subscriber/filter/struct.EnvFilter.html#directives
    filter_directives: info,tower_http=off,databend_client=off
log_source:
  quickwit:
    domain: http:https://127.0.0.1:7280
    index: otel-logs-v0_7
    timeout: 30s
trace_source:
  quickwit:
    domain: http:https://127.0.0.1:7280
    index: otel-traces-v0_7
    timeout: 30s
start the server:
./target/x86_64-unknown-linux-gnu/release/ltbridgecargo binstall bendsqlOr Look at bendsql for more installation.
login:
bendsql -udatabend -pdatabend -P3306 # user&pwd are set in docker-compose filecreate database
create database test_ltbridge;
use test_ltbridge;
create log table
CREATE TABLE logs (
    app STRING NOT NULL,
    server STRING NOT NULL,
    trace_id STRING,
    span_id STRING,
    level TINYINT,
    resources MAP(STRING, STRING) NOT NULL,
    attributes MAP(STRING, STRING) NOT NULL,
    message STRING NOT NULL,
    ts TIMESTAMP NOT NULL
) ENGINE=FUSE CLUSTER BY(TO_YYYYMMDDHH(ts), server);
CREATE INVERTED INDEX message_idx ON logs(message);
create trace table
CREATE TABLE spans (
	ts TIMESTAMP NOT NULL,
    trace_id STRING NOT NULL,
	span_id STRING NOT NULL,
	parent_span_id STRING,
	trace_state STRING NOT NULL,
	span_name STRING NOT NULL,
	span_kind TINYINT,
	service_name STRING DEFAULT 'unknown',
	resource_attributes Map(STRING, Variant) NOT NULL,
	scope_name STRING,
	scope_version STRING,
	span_attributes Map(STRING, Variant),
	duration BIGINT,
	status_code INT32,
	status_message STRING,
	span_events Variant,
	links Variant
) ENGINE = FUSE CLUSTER BY (TO_YYYYMMDDHH(ts));server:
listen_addr: 0.0.0.0:6778
timeout: 30s
log:
level: info
file: info.log
# for more details about filter_directives
# see: https://docs.rs/tracing-subscriber/latest/tracing_subscriber/filter/struct.EnvFilter.html#directives
filter_directives: info,tower_http=off,databend_client=off
log_source:
databend:
drvier: databend
domain: localhost
port: 3306
database: test_ltbridge
username: databend
password: databend
# use fulltext index(if you have databend commercial license), otherwise false
inverted_index: true
trace_source:
databend:
drvier: databend
domain: localhost
port: 3306
database: test_ltbridge
username: databend
password: databend./target/x86_64-unknown-linux-gnu/release/ltbridgeNote: You must run ltbridge locally and listen on port 6778(predefined for the grafana datasource) so that the processes in Docker can access it via http:https://host.docker.internal:6778.
See: opentelemetry-collector clickhouse exporter
server:
  listen_addr: 0.0.0.0:6778
  timeout: 30s
  log:
    level: info
    file: info.log
    # for more details about filter_directives
    # see: https://docs.rs/tracing-subscriber/latest/tracing_subscriber/filter/struct.EnvFilter.html#directives
    filter_directives: info,tower_http=off,databend_client=off
log_source:
  clickhouse:
    log:
      url: http:https://127.0.0.1:8123
      database: default
      table: otel_logs
      username: default
      password: a11221122a
      label:
        # specify labels to support grafana auto completion
        # must be low cardinality
        # if you don't know how to set, just set them to []
        # resource for this column: https://github.com/open-telemetry/opentelemetry-collector-contrib/blob/main/exporter/clickhouseexporter/exporter_logs.go#L147
        resources: ["host.arch", "telemetry.sdk.version", "process.runtime.name"]
        # attributes(LogAttributes): https://github.com/open-telemetry/opentelemetry-collector-contrib/blob/main/exporter/clickhouseexporter/exporter_logs.go#L152
        attributes: ["quantity", "code.function"]
      # convert {attributes_foo_bar_baz} => LogAttributes['foo.bar.baz']
      # only support attributes_xxx and resources_xxx
      replace_dash_to_dot: true
trace_source:
  clickhouse:
    trace:
      url: http:https://127.0.0.1:8123
      database: default
      table: otel_traces
      username: default
      password: a11221122a
      trace_ts_table: otel_traces_trace_id_ts
Note: Since there's no available rust clickhouse sdk that supports both nested type and map type, ltbridge has no choice but to use http + jsoneachrow, so 8123 is required.
- open grafana: localhost:3000
- navigate to expore
- choose Loki | Tempo
- Have fun!
Note: Before you search, you must send some data into quickwit or databend. Below are some tools that may help:
contributions from the community are welcomed and really appreciated. Feel free to open issues, submit pull requests, or provide feedback to help us improve this project.
This project is licensed under the MIT license.

