Getting a procs config going should be as easy as (on Debian):
apt install nim         # See also https://nim-lang.org/
nimble install procs    # Also installs $HOME/etc/procs conf
$HOME/.nimble/bin/procs # gives a help message
The Nim experience can sometimes have fairly rough-hewn edges, though. So far,
though, something like the above has worked for me on Gentoo Linux, Debian, and
Android Termux. procs only supports Linux /proc queries at the moment. If
the above nimble does not work, you can maybe just:
git clone https://github.com/c-blake/cligen
git clone https://github.com/c-blake/procs
cd procs; nim c -d:release --path:../cligen procs
mv procs SOMEWHERE_IN_$PATH
cp -r configs/cb0 ~/.config/procs
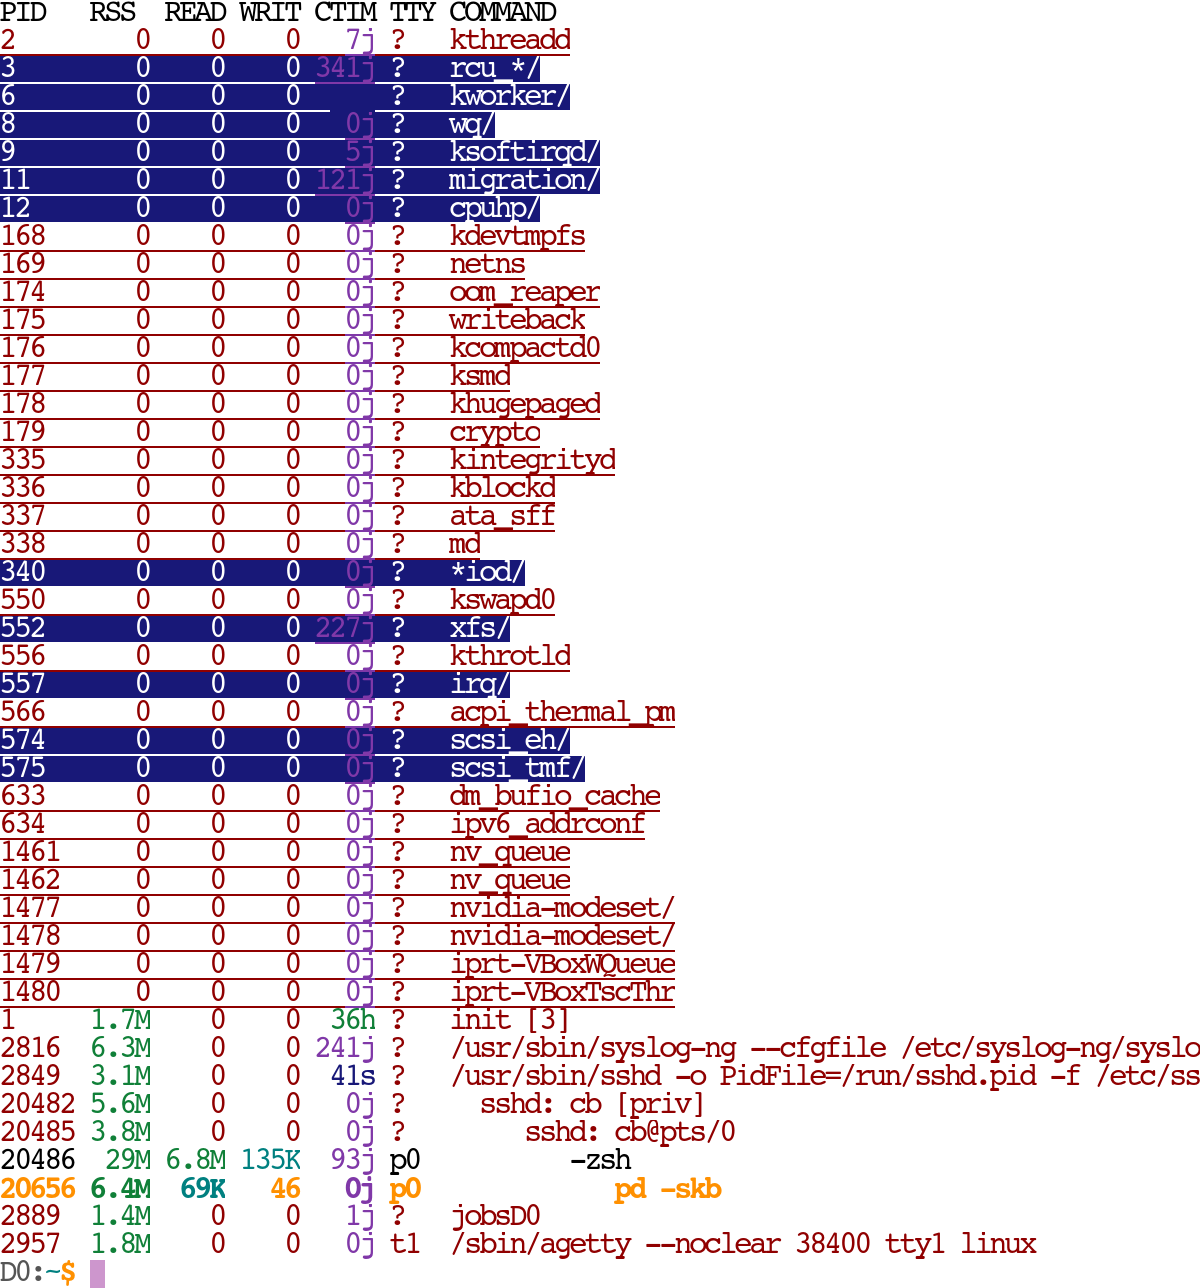
Here are some screenshots with many related kernel threads merged (command used is shown in the output):
and with all kernel threads merged into one row:
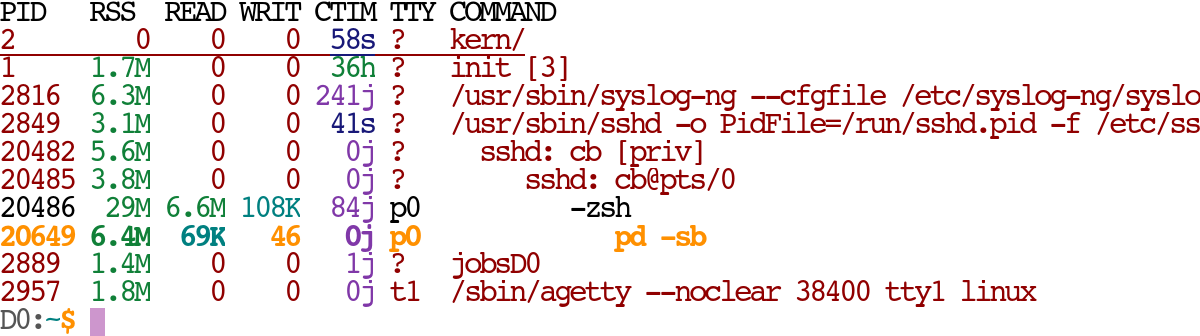
Merging/coloring categories/kinds are all very user-defined. In the above, kernel threads are underlined and processes marked as runnable are bolded, and my terminal makes bold default foreground color render as orange.
This program is a mix of various procps/top/vmstat/pidof/pgrep/pkill features.
It does environment-variable-driven themed display of process and system-wide
metadata colorized by builtin process traits and also based upon user-defined
process categories. It also supports "merging" or "rolling up" statistics for
processes related to each other in user-defined ways, e.g. kernel threads or
firefox processes. Conceptually, this is similar to what already happens with
process statistics for a multi-threaded program, but the relationship between
merged procs can be less reliant upon kernel categories.
Configuration is similar enough to https://github.com/c-blake/lc/ that they can
share theme files via symlinks. Some ideas like username abbreviation and the
kind/color systems carry over almost exactly. Unlike lc, procs is intended
to also be a user-friendly API/library interface to process statistics/data.
So, it can perhaps facilitate other new utility programs. Its only non-stdlib
dependency is cligen.
Though written in Nim, not C, this API/multicommand is about as efficient or
faster. procs tries hard not to make unnecessary system calls. E.g., with a
format of just '%p %c' it will only open & read /proc/*/stat files.1
Like lc, procs display is more of a "ps construction toolkit" than a pool of
pre-packaged formats. Fancy configs can create more work/slow things down.
Such is true with almost any featureful program. I have timed a basic process
listing as taking about 57% the run-time of the C-based procps ps, though
there are surely environments/configurations where ps can be faster.
One feature more unique to procs display is its ASAP mode. For output styles
with no sorting or merging, process rows are written to stdout as soon as the
data is collected. This lowers user-perceived "latency to first output" by a
very large multiple. That can help on a system that is struggling to make
progress/schedule the procs display process any CPU time.
ASAP style of flow also applies to procs find --actions=kill (more briefly
pk) , for example, to send signals as quickly as possible to misbehaving
matching programs which may be grinding a system to a near halt. The
pgrep/pkill in procps (at least as of version 3.3.15) read & select all
processes before acting upon any. While hopefully rare, when ASAP action
matters it can be very helpful.
If you create hard-links or sym-links from the procs executable to any of {
"pd", "pf", "pk", "pw", "scroll", "sc" }, then the multi-command can be bypassed
and those commands activate, respectively, procs display, procs find, procs find -akill, and procs find -await. Being a cligen multi-command you can
also type the shortest unique prefix for most things, e.g., procs f -ak.
procs display --delay 1 or more briefly pd -d1 aids a similar use case but
different theory of operation to top -ib. procs is not an interactive
program and has no compile/run-time curses/ncurses/terminal dependency. All
coloring/merging ideas generally available in pd are used for a differential
report. You can log to a file and look at a nicely embellished report later.
pd also allows user-defined sense of "idle". You can use traits besides CPU
activity like RAM/IO activity, and even things independent of having been
scheduled such as signal masks, nice value, etc. It does not print system-wide
stats each iteration - that is what procs scrollsy (or sc) is for. top
always felt "over bundled" to me.
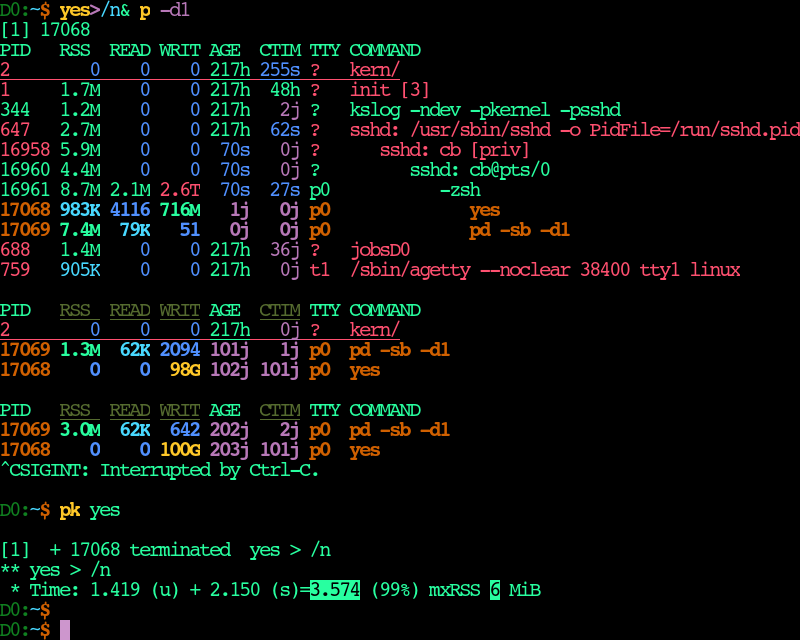
This is kind of new/unusual/abstract. So, here is a screenshot (p=pd -sb with
my configs/cb0 config) of GNU yes cruising along at 100 GB/s (no need for
pv!). A relevant part of configs/cb0/style is -DJ><R -oDJ><R which diffs
by cumulative jiffies, write, read & RAM and then sorts by the same. (You could
reverse said sort order/etc. if you like..)
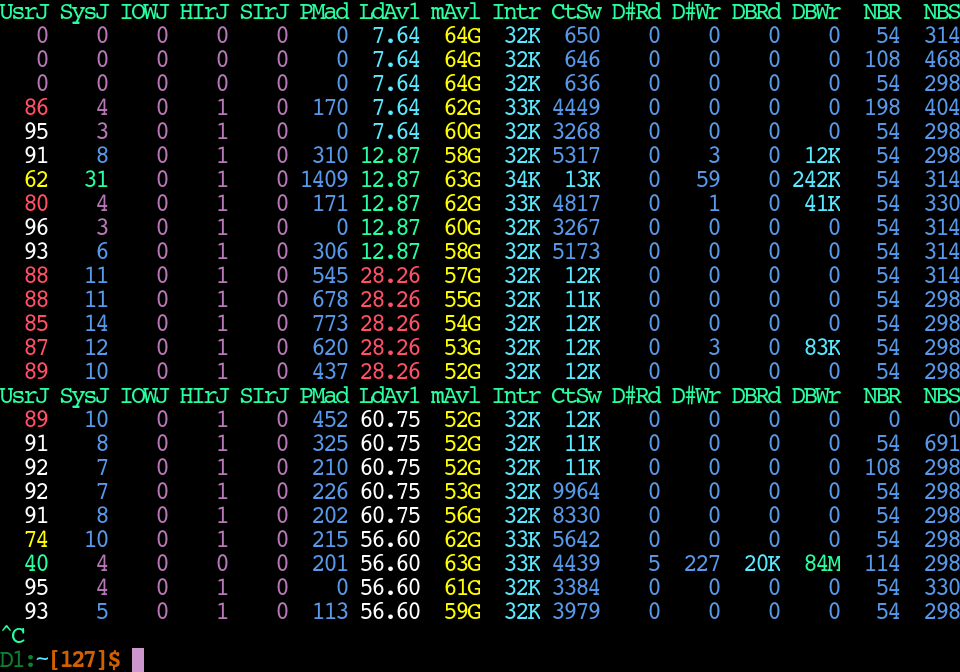
For system-wide statistics you can use procs scrollsy (aka sc). With default
format in configs/cb0/config:[scrollsy], it makes output like this:
top is really just a combination of pd -d1 & sc with usually less history
accessible via terminal scrollback. With two terminal windows you can get the
same data (much more really) in a more open/re-analyzable format.
wait/Wait actions of procs find (or pw) are more unusual functionality.
The selected set of processes is checked for lack of existence (via a 0 signal)
each delay separated interval. procs exits when either any or all (lower or
uppercase) of the processes have failed to exist at least once. Up to fast PID
recycling, this recreates features of the Bash wait/wait -n builtin for
processes unrelated to the wait-er.
procs is definitely a work in progress, but a nice enough bundle of useful
ideas to share. With so many features and just me as a user, there are surely
many bugs.
Footnotes
-
Meanwhile, Linux procps ps (
/bin/pson most Linux) opens, reads, parses & closes both /proc/PID/stat and /proc/PID/status. This makesprocs displayakapdroughly 2X faster. Using a/n -> /dev/nullsymlink,PROCS_CONFIG=/n tim 'pd -f%p\ %c>/n' '/bin/ps ax>/n'gives(2.8576 +- 0.0070)e-03 pd -f%p\ %c>/n&(5.0281 +- 0.0063)e-03 /bin/ps ax>/n. Adding process typology & highlights back (not usingPROCS_CONFIG=/n) slowspddown to3.9739 +- 0.0044 ms, still 1.27X faster than stock Linuxps. ↩