The Mildew Detector is a project which employs machine learning to teach an algorithm to be able to make a prediction on whether a leaf is infected with Powdery Mildew or not.
- Dataset Content
- Business Requirements
- Hypotheses
- Rationale
- ML Business Case
- Model Selection
- Dashboard Design
- CRISP-DM Workflow
- Future Developments
- Testing
- Bugs
- Technologies Used
- Deployment
- Credits
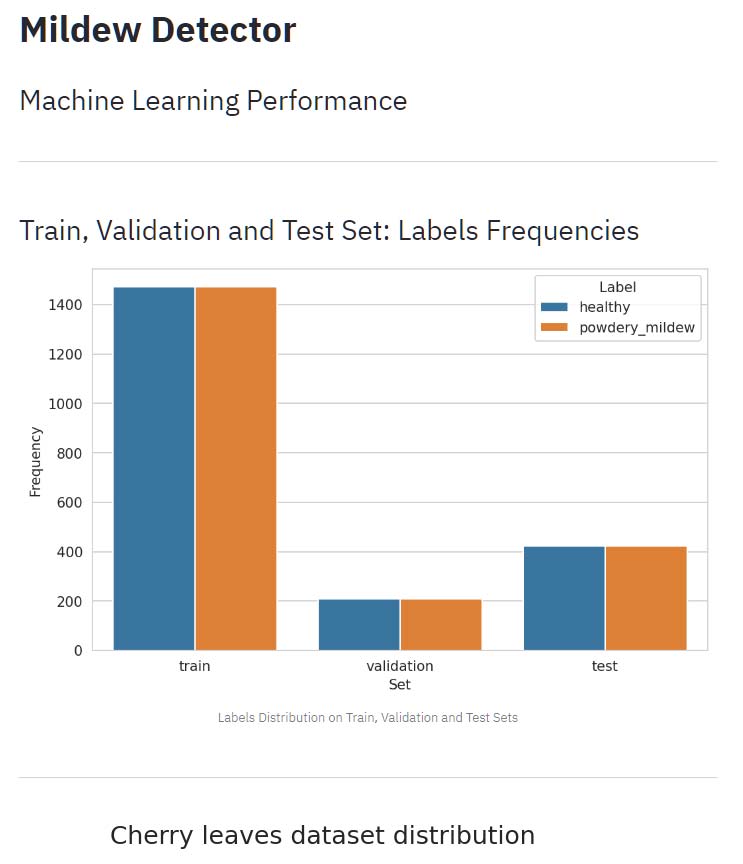
The dataset is made up of 4208 images of single cherry tree leaves, taken from healthy trees and those infected with Powdery Mildew. Each of these 'labels' contains 2104 images, with an even split between healthy and infected.
The dataset is sourced from Kaggle.
The business requirements for the project are as follows:
- Business requirement 1 - The client is interested in conducting a study to visually differentiate a healthy cherry leaf from one infected with Powdery Mildew.
- Business requirement 2 - The client is interested in predicting if a cherry leaf is healthy or infected with Powdery Mildew.
The fictional company, Farmy & Foods, has a number of cherry tree plantations and are experiencing problems with Powdery Mildew infections.
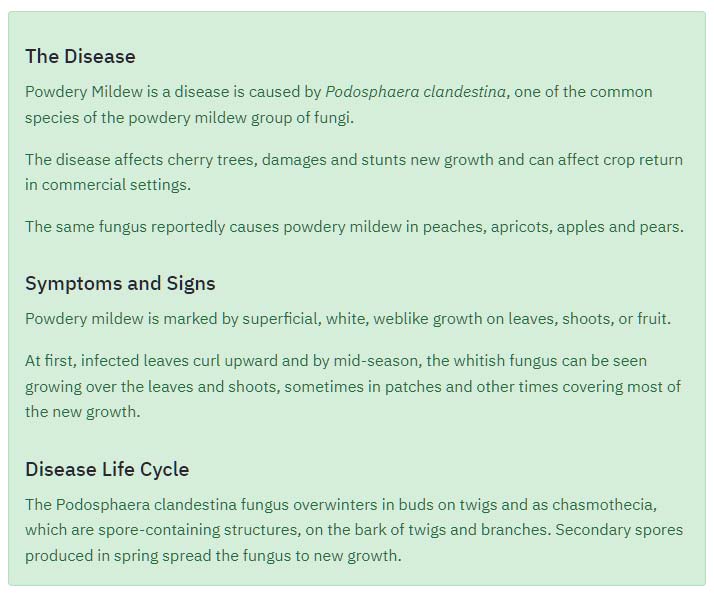
Powdery Mildew is a disease is caused by Podosphaera clandestina, one of the common species of the Powdery Mildew group of fungi. The disease affects cherry trees, damages and stunts new leaf growth and can affect crop return in commercial settings. The same fungus reportedly causes Powdery Mildew in peaches, apricots, apples and pears.
Currently, the company process to detect this infection involves manual checking of the cherry tree leaves. An employee spends around 30 minutes in each tree, taking a few samples of leaves and visually deciding if the leaf tree is healthy or has Powdery Mildew. If infection is suspected, the employee applies a chemical compound to kill the fungus. The time spent applying this compound is 1 minute.
The company has thousands of cherry trees, located on multiple farms across the country. As a result, this manual process is not scalable due to the time spent in the manual process inspection.
To save time, the IT team have suggested a Machine Learning system that detects instantly, using an image of a leaf, if the tree is healthy or has Powdery Mildew. A similar manual process is in place for other crops for detecting pests, and if this initiative is successful, there is a realistic chance to replicate this project for other crops.
The dataset is a collection of cherry leaf images, provided by the client from their plantations.
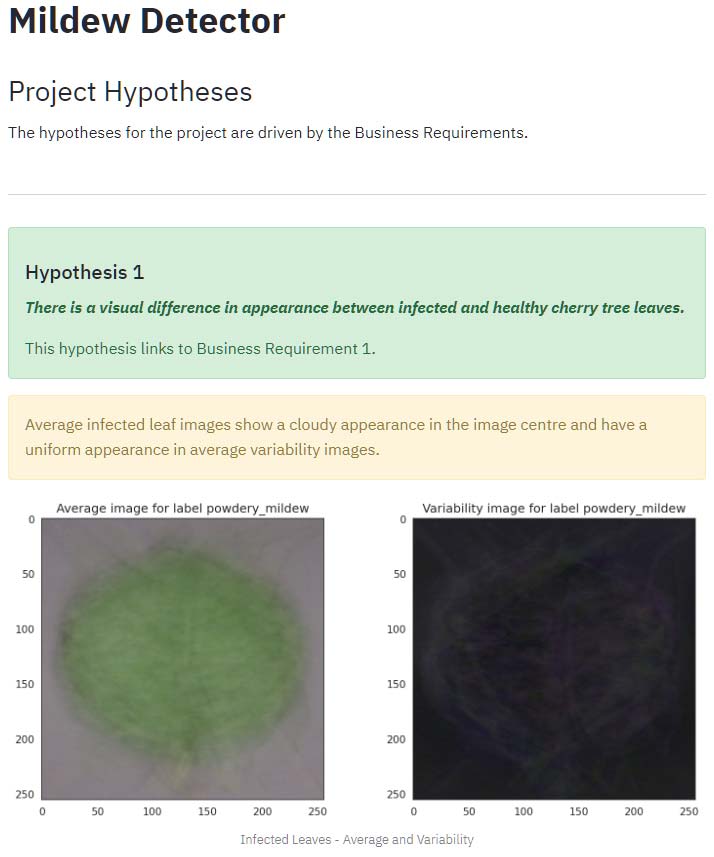
There is a visual difference in appearance between infected and healthy cherry tree leaves.
- Business requirement 1 requires a study to visually differentiate a healthy leaf from an infected one.
- The hypothesis will be investigated with an average image study.
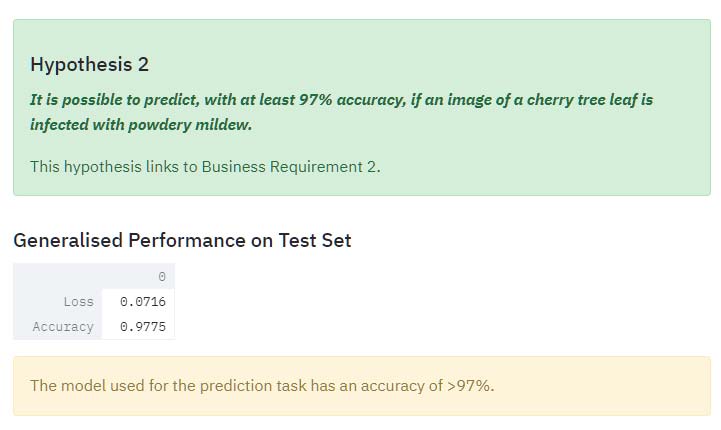
It is possible to train a model to predict, with at least 97% accuracy, if an image of a cherry tree leaf is infected with powdery mildew.
- Business requirement 2 is that the client wants to predict if a cherry tree is infected or healthy, with at least 97% accuracy.
- The hypothesis will be tested by training a model on the train and test images and calculating the accuracy with a validation set.
The business requirements have been matched to the tasks using the CRISP-DM
workflow steps.
User Stories can be found, along with Tasks, grouped into Epics matching the
CRISP-DM workflow, on the project board here:
Mildew Detector Project Board
- As a client I can visually differentiate a healthy from an infected leaf so that I can visually determine if leaves are infected or not.
- As a client I can view the difference between average healthy and infected leaves so that I can compare leaves.
- As a client I can display a montage of images of infected and healthy leaves so that I can see differences between them.
- Calculate standard deviation and mean of infected and healthy leaf images.
- Display on the Streamlit dashboard, average and average variability images for infected and healthy leaves.
- Display differences between healthy and infected leaves on the Streamlit dashboard.
- Create an image montage viewer on the Streamlit dashboard to display a selection of either healthy or infected leaf images.
- As a client I can determine that the Machine Learning Model is accurate to at least 97% so that I can be sure the results are accurate.
- As a client I can upload an image of a cherry tree leaf so that I can get an indication of whether it is infected or healthy.
- As a client I can download a report so that I can view the results outside of the dashboard environment.
- Build a binary classifier.
- Validate the accuracy of the model with the validation set.
- Display the results on the Machine Learning Performance page of the Streamlit dashboard.
- Use the model to create the Mildew Detector page of the Streamlit dashboard.
- An ML model is required to predict if a leaf is infected with Powdery Mildew or not, based on the provided dataset. The problem is a binary one. The leaf is either infected or healthy and requires a supervised, 2-class, single-label, classification model.
- The ideal outcome is to provide the company with a faster and more reliable detector for Powdery Mildew detection.
- The model success metrics are an accuracy of 97% or above on the test set.
- The model output is defined as a flag, indicating if the leaf has Powdery Mildew or not and the associated probability of being infected or not. The workers will take a picture of a leaf and upload it to the App.
- Heuristics: The current detection method is based on a manual inspection. Visual collection and inspection is slow and it leaves room to produce inaccurate diagnostics due to human error.
- The training data to fit the model comes from the leaves database provided by Farmy & Foody company and uploaded on Kaggle. This dataset contains 4208 images of cherry leaves.
- As set out in the ML Business Case, the required model is a supervised, 2-class, single-label, classification model.
- The selected model (v1) was one of three explored with the available data.
- Each model used a different optimiser:
- v1 - Adagrad
- v2 - Adadelta
- v3 - Adam
- The selected model (v1) was chosen for its accuracy while not overfitting.
- The models trialed are discussed further in the Model Selection Readme.
Streamlit MultiPage was used to group 5 pages into one dashboard with a menu.
The summary page contains a brief summary of the project, together with three sections:
- Disease Information. Information about Powdery Mildew disease, its causes, symptoms and life cycle.
- Business Requirements. The requirements of the client for a successful outcome to the project.
- Project Dataset. A summary of the dataset details.
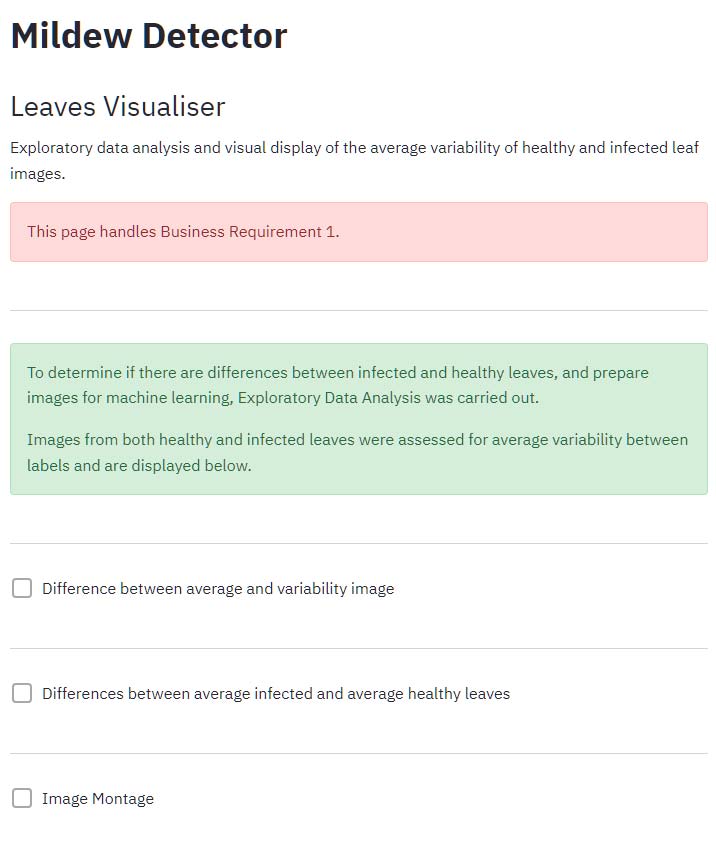
This page handles Business Requirement 1
The leaves visualiser page displays a brief summary and three checkboxes
which load up the relevant image display:
- Difference between average and variability image.
- Differences between average infected and average healthy leaves.
- Image Montage of either healthy or infected leaves.
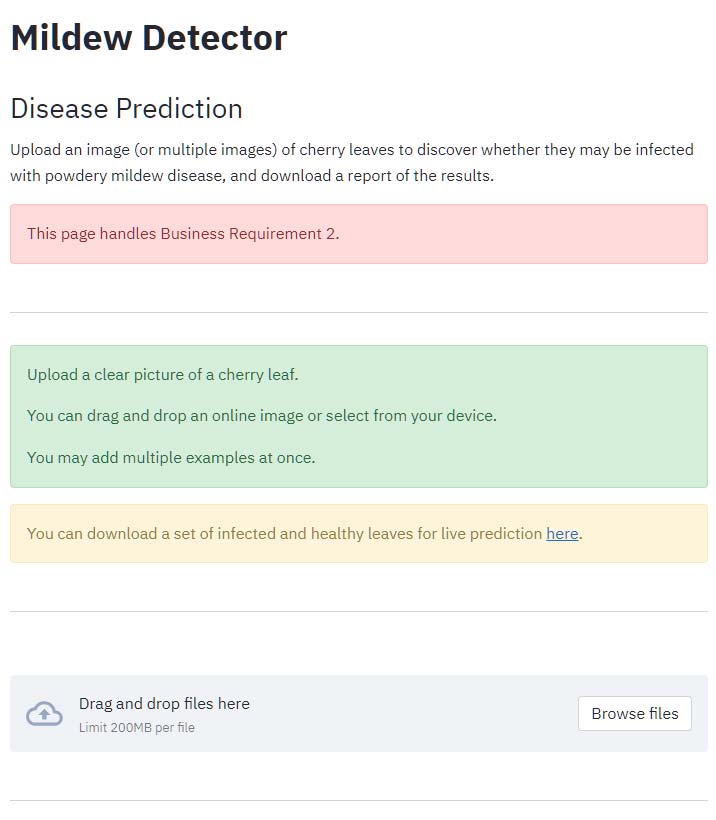
This page handles Business Requirement 2
The mildew detector page shows an information section, together with
instructions on how to use the detector and a link to sample images.
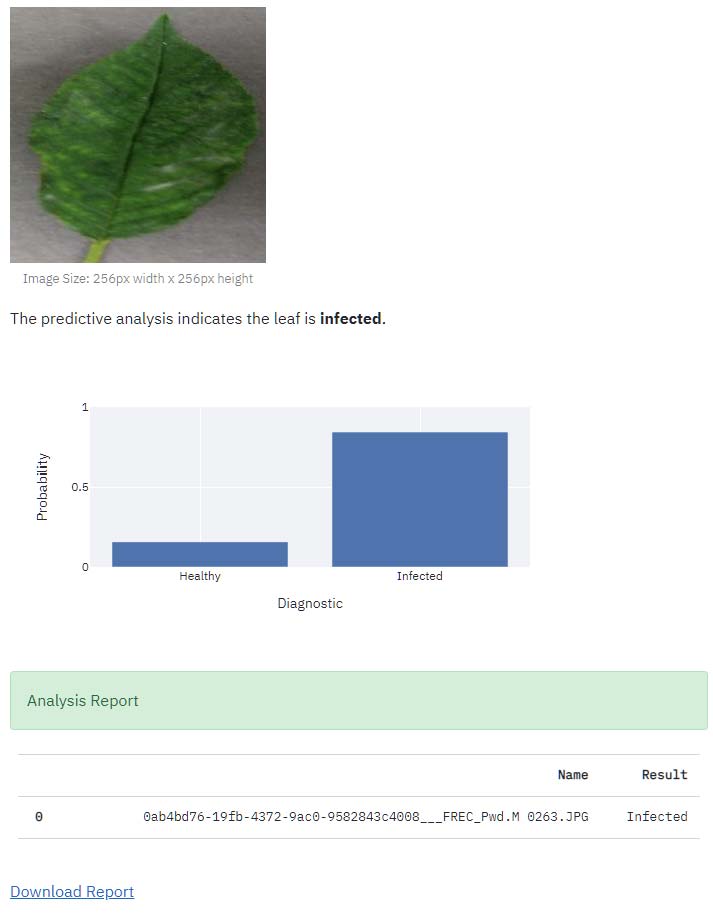
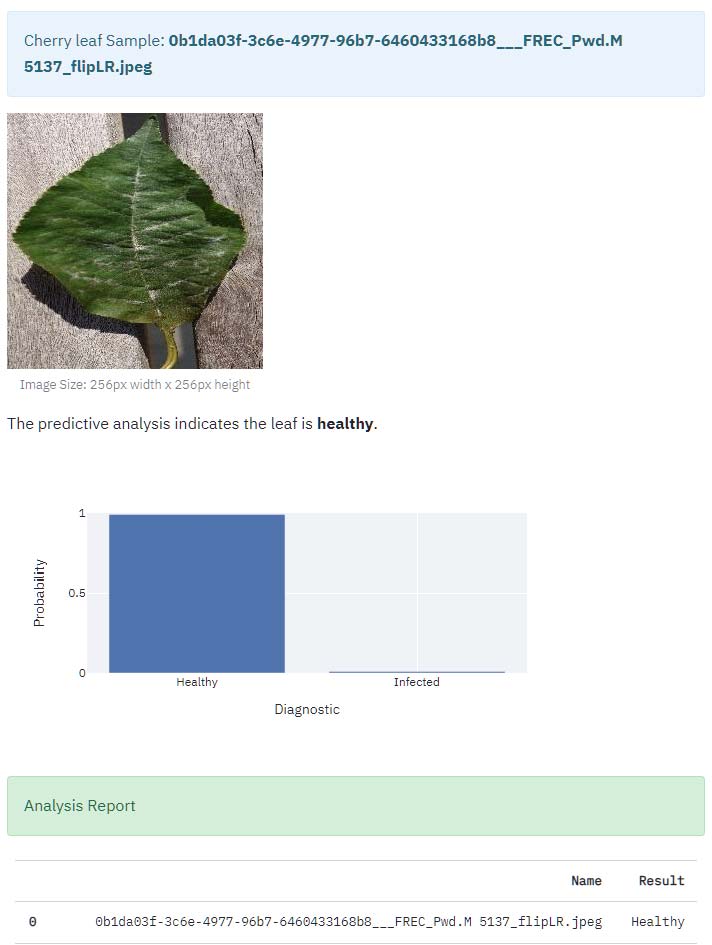
When an image is uploaded, a report is generated which displays:
- A display of the image.
- A message indicating the model prediction.
- A probability chart.
- A downloadable report.
The hypothesis page presents the hypotheses for the project, the business requirement they are targeted towards, results of the analysis and conclusions for each model.
This page handles Business Requirement 2
The Label Frequency charts for train, test and validation sets confirm how the
data was split for training and validating the model.
The model history, accuracy, losses and confusion matrix are shown in the figures below the label frequency displays. The accuracy is measured at greater than 97%, satisfying part of the requirements of Business Requirement 1.
User stories were created to handle and plan aspects of the project which form part of the business requirements of the client. These were mapped to Epics covering the stages of the CRISP-DM workflow.
Additionally, a series of tasks were created, covering the main steps in building the project.
The Epics cover the stages of CRISP_DM:
- Business Understanding
- Data Understanding
- Data Preparation
- Modelling
- Validation
All stories and tasks are organised on the project board
- The model could be trained on other species.
- The model would be best incorporated into a mobile app to get instant results in the field.
- All pages have been tested to ensure they load and any features work as expected and no errors are produced.
- The menu has been used to navigate between pages, ensuring the links work as expected.
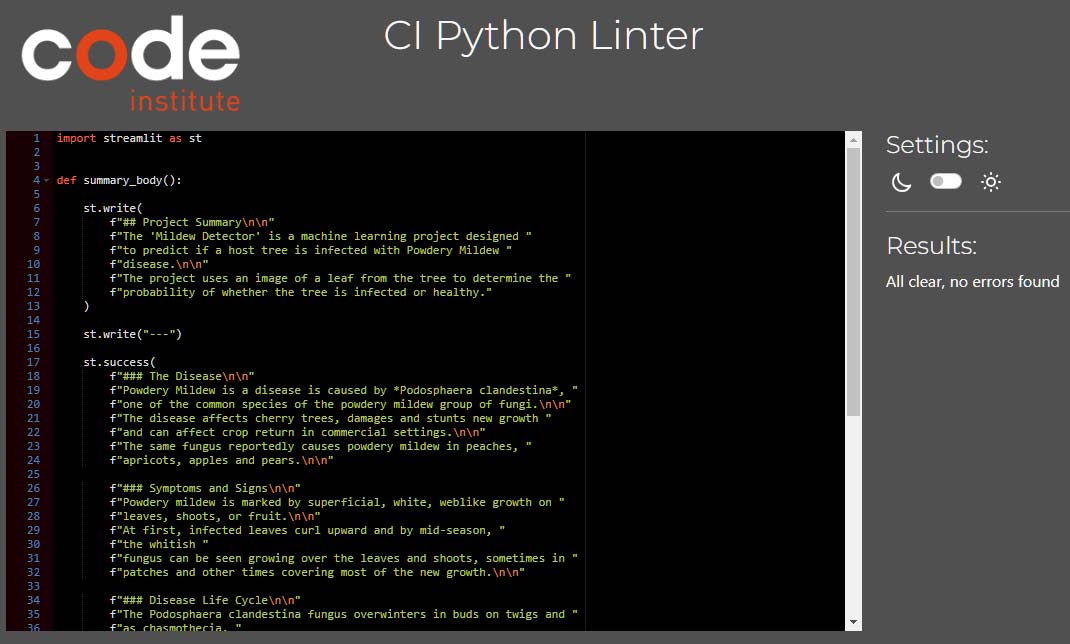
- The streamlit pages have been copied into the CI PEP8 checker and all code passed with no errors.
One image, infected with Powdery Mildew, was found to be predicted as healthy
during testing. This is a part of machine learning, as overfitting is
avoided while trying to get a high accuracy. The confusion matrix shows
that 8 out of 422 images of infected leaves were predicted to be healthy.
However, it may be possible to further tune the model to reduce false
predictions, if the client feels this is more important. Additionally, it may
be possible to require 2-3 leaf images per tree, to reduce the likelihood of
false readings for infected leaves.
These are future conversations to have with the client once the dashboard
prototype is deployed.
- Git
Used for version control alongside GitHub. - GitHub
Used to store the project and utilise git version control. - Heroku
Used to deploy project. - CI PEP8 Testing
Used to validate all Python code.
- Log in to your Github account.
- Navigate to repositories and select 'New'.
- Select the 'Code Institute' template from the 'Repository Template' menu.
- Give your repository a name and select 'Create Repository'.
- When the repository has been created select 'Gitpod' to open a new workspace.
- Log in to your Heroku account Heroku.
- From the home page select 'New', then select 'Create New App' from the drop-down.
- Provide a name for your app and select your region.
- At the top of the page select the 'Deploy' tab.
- For the preferred deployment method select 'Github'.
- Search for your repository name and connect.
- Additionally, automatic deploys can be enabled for deployment after each push to Github.
- Sign in to Github and go to my repository
- At the top of the page select 'Fork'.
- The Fork will now be added to your repositories.
- Sign in to Github and go to my repository
- Select the green 'Code' button.
- Select from one of the cloning options HTTPS, SSH or Github CLI. Click the clipboard icon to copy the URL.
- Open git bash
- Enter ‘git clone’ into the text box and then paste the respository URL and select enter.
For more information on cloning please read the github documentation here
- The Code Institutes 'Malaria Detector' walkthrough project which inspired the main functionality of the application.
- Stack Overflow for help with errors encountered during development.
- W3Schools - Python for reference and research.
- My Code Institute mentor.
- I was able to get some inspiration about potential structures for the project from the following previous student repositories, supplied by my mentor for information.
- Background information on the disease was sourced from: https://extension.psu.edu/powdery-mildew-of-cherry-and-plum-in-home-fruit-plantings
- The main image is by Pedro Sanz, sourced from Unsplash.


