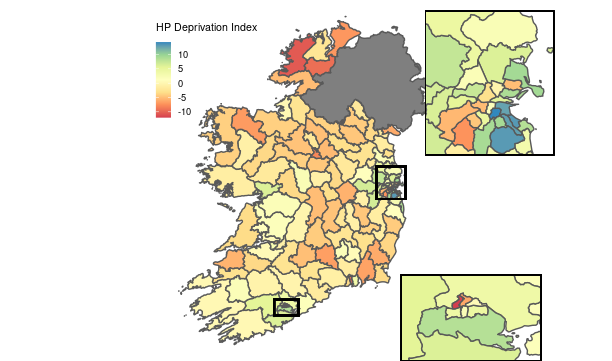
A bank of maps in geojson format which can be used in R. While they are given as a collection of local electoral areas or electoral divisions, they can be very easily aggregated up to produce shapes for counties, administrative areas, NUTS2 and NUTS3 regions. They include
lea_166 is the current set of 166 local electoral areas, plus Northern Ireland.
lea_137 is the old set of 137 local electoral areas which was used at the time of the last Census in 2016, plus Northern Ireland.
ed_3441 and ed_3409 are two maps for electoral divisions with 3,441 and 3,409 individual regions (plus Northern Ireland), since different datasets use different aggregations of the electoral divisions.
You can import the maps directly from the web using st_read:
lea_166 <- st_read("https://raw.githubusercontent.com/brendanjodowd/maps/main/lea_166.geojson")
lea_137 <- st_read("https://raw.githubusercontent.com/brendanjodowd/maps/main/lea_137.geojson")
ed_3441 <- st_read("https://raw.githubusercontent.com/brendanjodowd/maps/main/ed_3441.geojson")
ed_3409 <- st_read("https://raw.githubusercontent.com/brendanjodowd/maps/main/ed_3409.geojson")
The st_read() function (part of the sf package for R) turns the geojson object into an sf (simple features) object. An sf object is a data-frame-like object which is integrable with tidyverse and the ggplot2 plotting system. For example, you can join each of these maps to other datasets using full_join(), or you can plot it using ggplot(lea_166) + geom_sf(). Two useful guides from Jesse Sadler on GIS in R and simple feature structure may be of use.
- Shannon esturary is clipped out of shapes.
- Regions can be easily aggregated up to produce counties, admin areas, NUTS2 and NUTS3 regions, with full nesting.
- Northern Ireland outline included
- Includes
cso_namevariable for LEAs and EDs, which allows easy linking to CSO PxStat files, - Includes
hp_namevariable for LEAs forlea_137anded_3409, which allows easy linking to Pobal HP data.
Maps for counties, admin areas, NUTS2 and NUTS3 regions can be produced using either of the shapefiles provided. To produce a map of counties, for example, use:
county_map <- lea_166 %>% group_by(COUNTY) %>% summarise(geometry = st_union(geometry) , AREA=sum(AREA))
See sample_map.R for code. Uses Pobal HP data from here. With thanks to David Wachsmuth for this useful blog post.
The maps are based on open data maps from Ordnance Survey Ireland (OSi) and Ordnance Survey of Northern Ireland (OSNI), and manipulated using tools including the rmapshaper package. The OSi maps are available under the Creative Commons Attribution 4.0 Licence, while the OSNI maps are available under the UK Open Government Licence. Both of these licences allow the sharing and manipuation of this data provided that the source is acknowledged.
Sources of shapefiles:
- Local Electoral Areas - The ones in use since 2019
- Local Electoral Areas 2015 - The ones in use at the time of the 2016 Census
- Electoral Divisions
- ECAD-CSO lookup table - Not a map but a table, used to link ED_ID in map with ID used in CSO files.
- Ireland Landmask - Used to cut shannon estuary out of shapes that border it. The default maps show a solid region at the esturary and I'm not too fond of that.
- Northern Ireland outline - This one is from the Ordnance Survey of Northern Ireland.
