These criteria were applied on the selection stage(GRID):
Events:
- >= 4 tracks
Tracks:
- Has Point On inner OR outer ITS Layer
- Not ITS SA
- |dca1| < 3 && |dca0| < 3;
<class 'pandas.core.frame.DataFrame'>
RangeIndex: 110004 entries, 0 to 110003
Data columns (total 49 columns):
 #   Column            Non-Null Count   Dtype
---  ------            --------------   -----
 0   RunNum            110004 non-null  int32
 1   PeriodNumber      110004 non-null  int64
 2   OrbitNumber       110004 non-null  int64
 3   BunchCrossNumber  110004 non-null  int64
 4   Mass              110004 non-null  float32
 5   Pt                110004 non-null  float32
 6   Q                 110004 non-null  int32
 7   Rapidity          110004 non-null  float32
 8   Phi               110004 non-null  float32
 9   ZNAenergy         110004 non-null  float32
 10  ZNCenergy         110004 non-null  float32
 11  ZPAenergy         110004 non-null  float32
 12  ZPCenergy         110004 non-null  float32
 13  VtxX              110004 non-null  float32
 14  VtxY              110004 non-null  float32
 15  VtxZ              110004 non-null  float32
 16  VtxContrib        110004 non-null  int32
 17  VtxChi2           110004 non-null  float32
 18  VtxNDF            110004 non-null  float32
 19  SpdVtxX           110004 non-null  float32
 20  SpdVtxY           110004 non-null  float32
 21  SpdVtxZ           110004 non-null  float32
 22  SpdVtxContrib     110004 non-null  int32
 23  V0Adecision       110004 non-null  int32
 24  V0Cdecision       110004 non-null  int32
 25  ADAdecision       110004 non-null  int32
 26  ADCdecision       110004 non-null  int32
 27  V0Afired          110004 non-null  bool
 28  V0Cfired          110004 non-null  bool
 29  ADAfired          110004 non-null  bool
 30  ADCfired          110004 non-null  bool
 31  STPfired          110004 non-null  bool
 32  SMBfired          110004 non-null  bool
 33  SM2fired          110004 non-null  bool
 34  SH1fired          110004 non-null  bool
 35  OM2fired          110004 non-null  bool
 36  OMUfired          110004 non-null  bool
 37  IsTriggered       110004 non-null  bool
 38  nTracklets        110004 non-null  int32
 39  nTracks           110004 non-null  int32
 40  ZDCAtime_0        110004 non-null  float32
 41  ZDCAtime_1        110004 non-null  float32
 42  ZDCAtime_2        110004 non-null  float32
 43  ZDCAtime_3        110004 non-null  float32
 44  ZDCCtime_0        110004 non-null  float32
 45  ZDCCtime_1        110004 non-null  float32
 46  ZDCCtime_2        110004 non-null  float32
 47  ZDCCtime_3        110004 non-null  float32
 48  FORChip           110004 non-null  object
dtypes: bool(11), float32(24), int32(10), int64(3), object(1)
memory usage: 18.8+ MB
<class 'pandas.core.frame.DataFrame'>
MultiIndex: 26978093 entries, (0, 0) to (110003, 3)
Data columns (total 13 columns):
 #   Column                  Dtype
---  ------                  -----
 0   T_NumberOfSigmaTPCPion  float32
 1   T_Eta                   float32
 2   T_Phi                   float32
 3   T_Px                    float32
 4   T_Py                    float32
 5   T_Pz                    float32
 6   T_Q                     int32
 7   T_HasPointOnITSLayer0   bool
 8   T_HasPointOnITSLayer1   bool
 9   T_ITSModuleInner        int32
 10  T_ITSModuleOuter        int32
 11  T_TPCNCls               int32
 12  T_TPCRefit              bool
dtypes: bool(3), float32(6), int32(4)
memory usage: 1.2 GB
.dataframe tbody tr th {
    vertical-align: top;
}

.dataframe thead th {
    text-align: right;
}
| count | mean | std | min | 25% | 50% | 75% | max | |
|---|---|---|---|---|---|---|---|---|
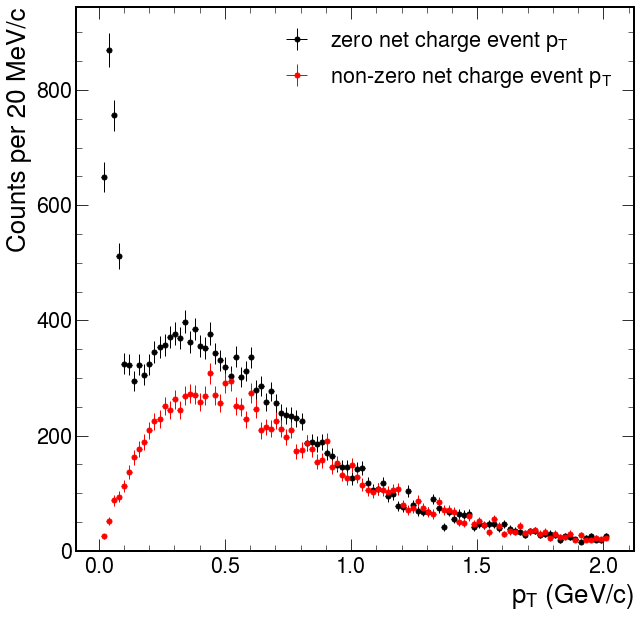
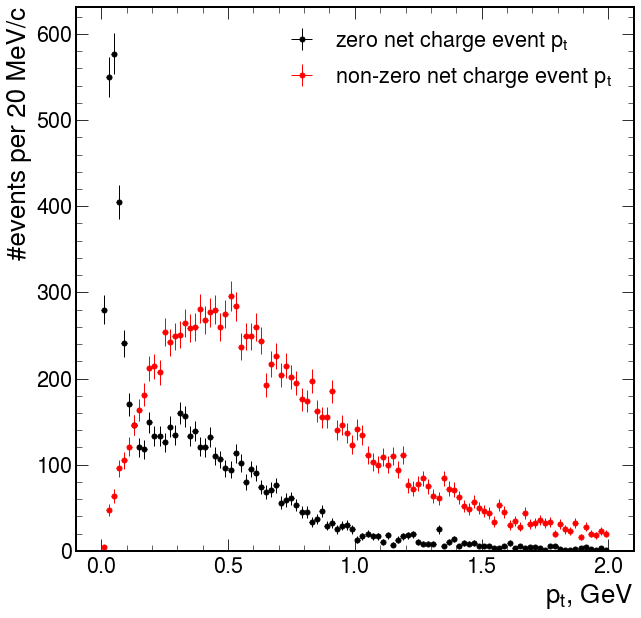
| zero net charge event |
19456.0 | 0.837667 | 12.995872 | 0.000275 | 0.215188 | 0.483686 | 0.846086 | 1726.771484 |
| non-zero net charge event |
13762.0 | 1.163582 | 12.508871 | 0.010555 | 0.386721 | 0.648763 | 1.049536 | 1328.583740 |
C:\Users\bdrum\AppData\Roaming\Python\Python39\site-packages\mplhep\plot.py:238: RuntimeWarning: invalid value encountered in sqrt
  _yerr = np.sqrt(h)
It's known that global tracks consist from ITS and TPC identification, in our case we can implicitly add checks for TPC identification track and see what happens with the data.
Let's aply further conditions for the tracks:
- |NumberOfSigmaTPCPion| < 3
- Number of TPC Clusters > 50
- TPCRefit
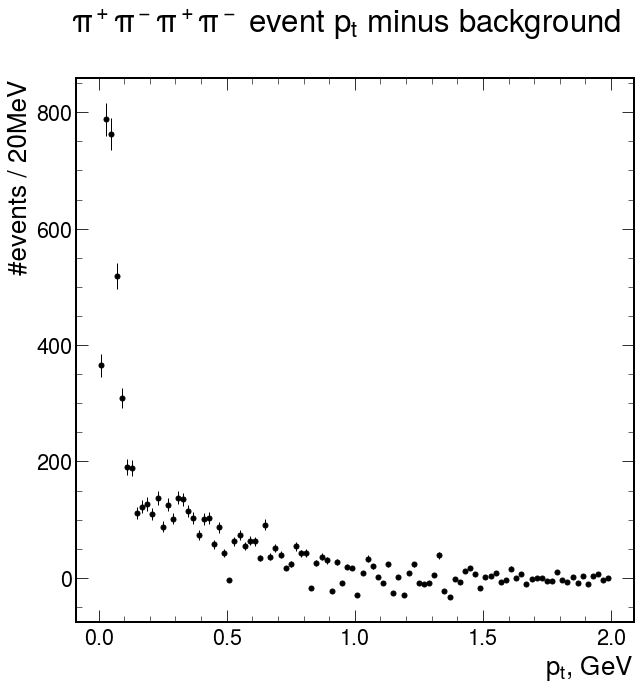
There is an idea about that tracks with small energies (low pt) not able to reach TPC. Idea is that addding such condition will decrease our signal and background level.
As we can see above adding of gobal tracks will decrease statistics level, but it is correct for both signal and background. Let's estimate what number of global tracks in 4 tracks is enough:
Here we see such construction each row contains three plots:
- starting point or what we have (first cell correspond our initial plot at the very begining of this notebook)
- what we will throw
- the difference between 1 and 2
As we can see in case of transition from zero global tracks to one we will lose only background. I guess it's easy to see that the best case when we throw almost only background event is more than 2 global tracks in event.
In further analysis I will be use this case. 'ITS & (>= 2TPC)'
There are some situations when CCUP9 trigger could be fired false: It may occured when some fake or random track fires FOR and trigger will provide.
We can check list of FORs of event and what chipkey has each of four tracks. In case it has matches and produce back to back topology this means correct trigger state.
See debugging details in one of the issue
Let's do the same thing as we do few cell above and let's try to understand what we will throw after splitting event by fake triggered or not:
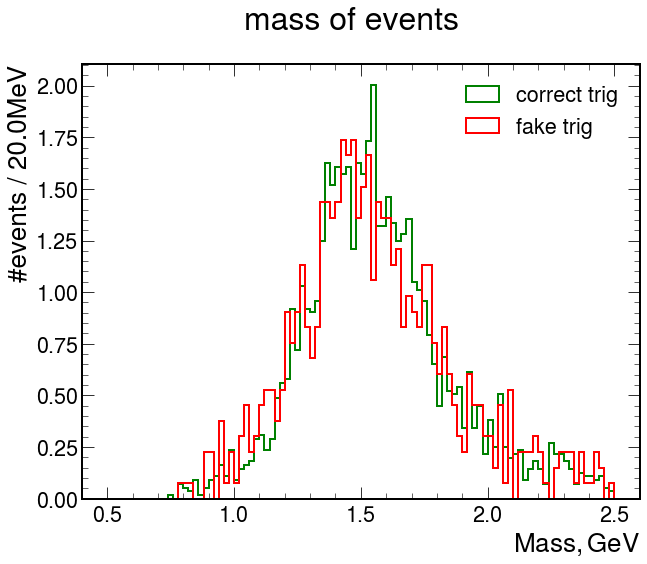
Let's see how looks masses for correct and fake trigger events:
As we can see above the shape of masses for fake trigger and correct trigger the same. Here we use pdf view for a normalization purposes. Despite of this fact we saw on
In further analysis we will use only correct trigger events. Also we hope that it will make our data closer to MC quality.
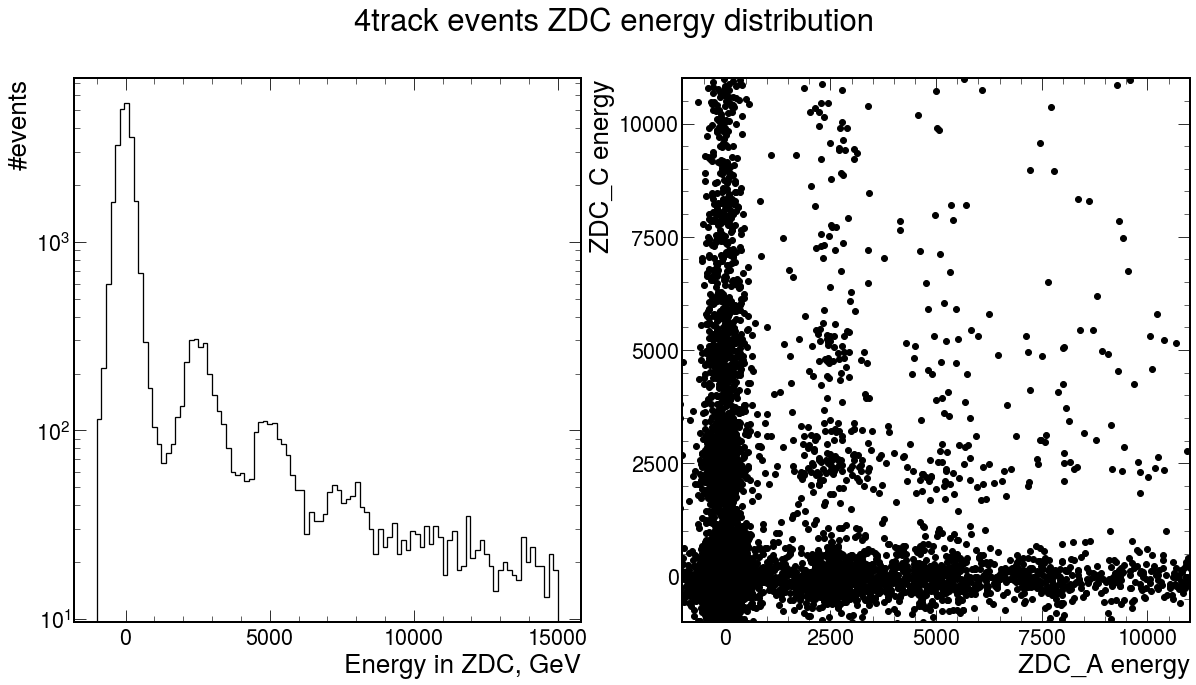
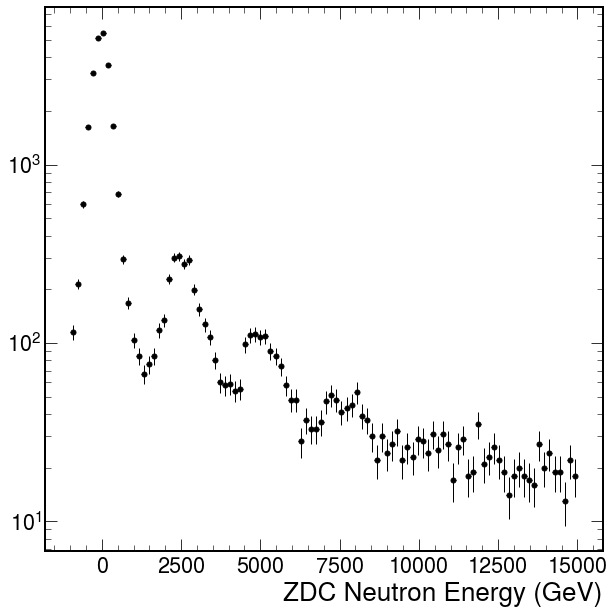
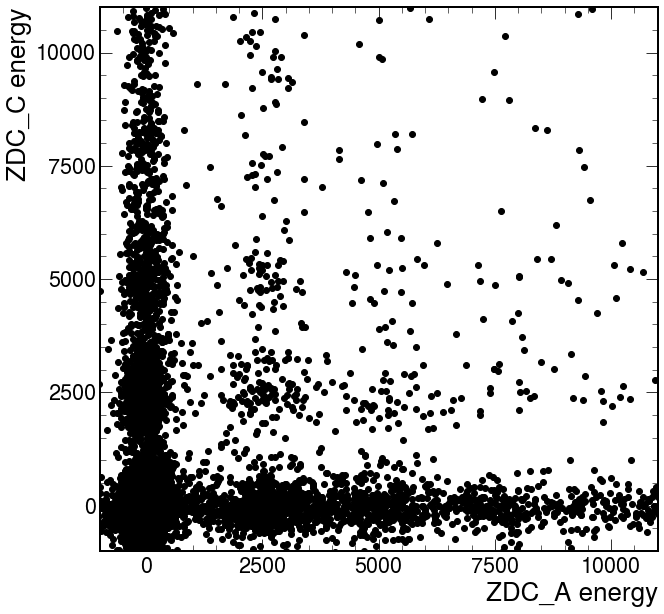
ZDC again allows us to make signal more clear. Neutrons in ZDC could be a markers about peripheral events.
No handles with labels found to put in legend.
No handles with labels found to put in legend.
No handles with labels found to put in legend.
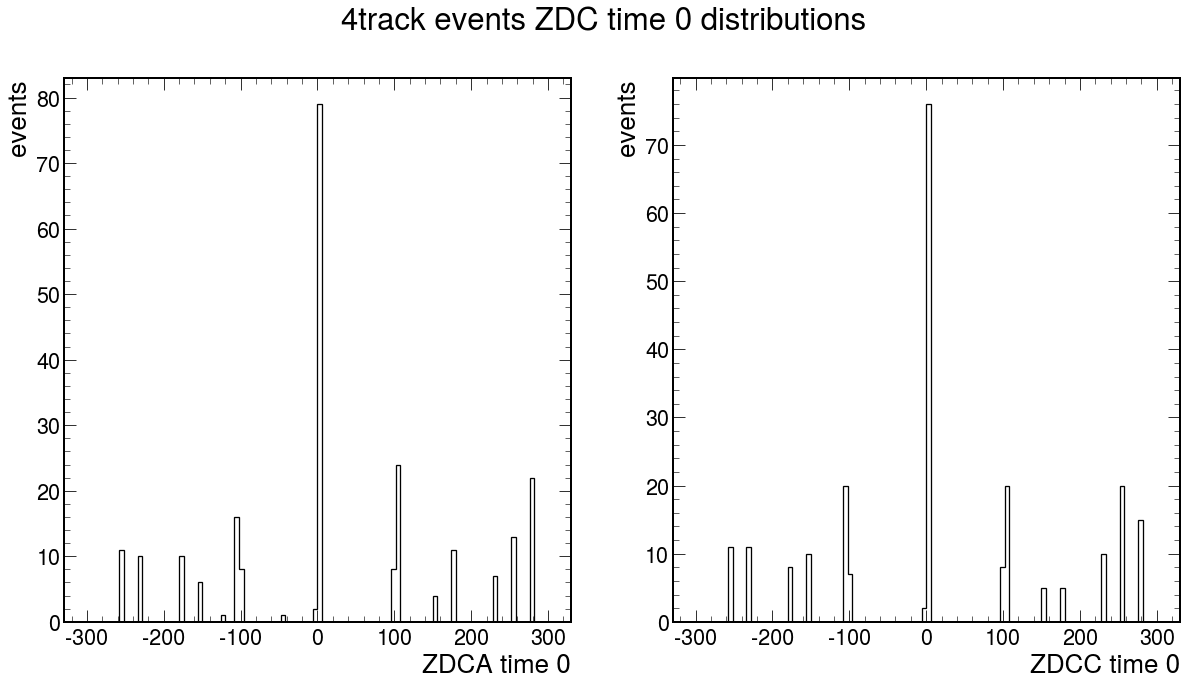
Beside energy distirbution we also have to make corrections for ZDC timing:
No handles with labels found to put in legend.
Event called passed ZDC cuts if satisfied such criteria:
- For only one of the two sides
- neutrons energy less or equal than given parameter ZDC_En value
- or
- one of ZDC times not in an interval of +- ZDC_Time_Delta parameter value
.dataframe tbody tr th {
    vertical-align: top;
}

.dataframe thead th {
    text-align: right;
}
| count | mean | std | min | 25% | 50% | 75% | max | |
|---|---|---|---|---|---|---|---|---|
| ZDC < 5TeV | abs(ZDC_times) >100 | 6605.0 | 0.408039 | 2.210536 | 0.000275 | 0.071012 | 0.281112 | 0.548197 | 176.975204 |
| ZDC > 5TeV & abs(ZDC_times) <=100 | 3032.0 | 0.596154 | 0.887427 | 0.002845 | 0.259760 | 0.495125 | 0.785955 | 42.316540 |
.dataframe tbody tr th {
    vertical-align: top;
}

.dataframe thead th {
    text-align: right;
}
| count | mean | std | min | 25% | 50% | 75% | max | |
|---|---|---|---|---|---|---|---|---|
| orig |
19456.0 | 0.837667 | 12.995872 | 0.000275 | 0.215188 | 0.483686 | 0.846086 | 1726.771484 |
|
|
6605.0 | 0.408039 | 2.210536 | 0.000275 | 0.071012 | 0.281112 | 0.548197 | 176.975204 |
.dataframe tbody tr th {
    vertical-align: top;
}

.dataframe thead th {
    text-align: right;
}
| count | mean | std | min | 25% | 50% | 75% | max | |
|---|---|---|---|---|---|---|---|---|
| zero net charge event |
6605.0 | 0.408039 | 2.210536 | 0.000275 | 0.071012 | 0.281112 | 0.548197 | 176.975204 |
| non-zero net charge event |
13762.0 | 1.163582 | 12.508871 | 0.010555 | 0.386721 | 0.648763 | 1.049536 | 1328.583740 |
Now let's try to see what tracks we lost from signal area and what contribution they have:
TPC and ITS has different coverage for polar angle:
Perhaps we have tracks that not only can't reach TPC, but also has
Below we can see polar angle distribution for tracks that covers three cases:
- All tracks from events were reconstructed by ITS and TPC
- Only ITS tracks from events with only part TPC tracks. Here tracks that not reconstructed by TPC
- All tracks from events were reconstructed by ITS or TPC
We can see small gaps with for the second case, that allow to speak about correctness of the suggestion, but anyway low energy of tracks is the main reason why TPC can't reconstructed tracks.
Let's see on the mass distribution of the events
.dataframe tbody tr th {
    vertical-align: top;
}

.dataframe thead th {
    text-align: right;
}
| count | mean | std | min | 25% | 50% | 75% | max | |
|---|---|---|---|---|---|---|---|---|
| ft_zq_all_cuts | 2418.0 | 1.613113 | 0.390436 | 0.740946 | 1.383315 | 1.549550 | 1.747386 | 4.907002 |
| ft_nzq_pt_cut | 663.0 | 1.413462 | 0.563853 | 0.637530 | 0.978157 | 1.344274 | 1.708745 | 4.250375 |
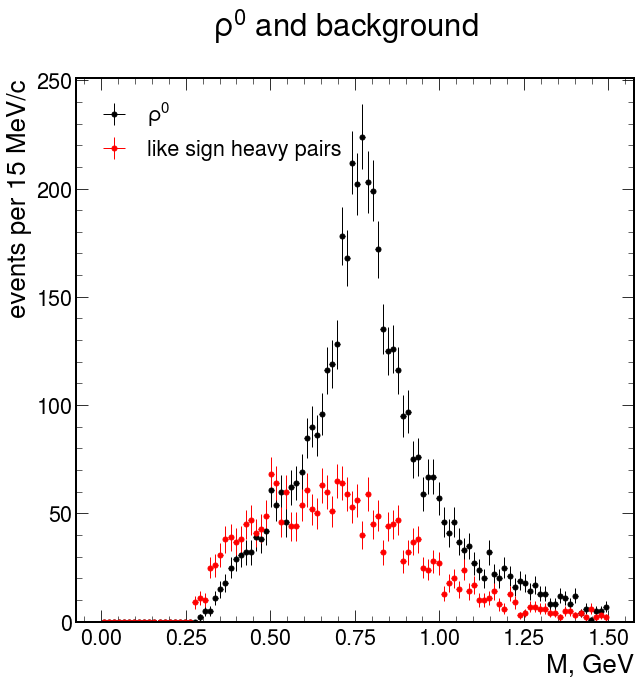
In our process 4 pions were producted. The most probably intermediate state including two pions and
We can see this on distribution of mass that can be obtained as all combinations of pairs from intial four tracks, i.e. only four pairs:
Here we can plot two distirbutions:
- Make all possible(4) combinations of pairs. Then take lightest and pair that belong to one combination with that. Plot masses of these two pairs.
- Plot masses of masses from possible combinations.
.dataframe tbody tr th {
    vertical-align: top;
}

.dataframe thead th {
    text-align: right;
}
| count | mean | std | min | 25% | 50% | 75% | max | |
|---|---|---|---|---|---|---|---|---|
| heavy | 4836.0 | 0.812236 | 0.259066 | 0.291725 | 0.674686 | 0.778129 | 0.902377 | 3.544038 |
| light | 4836.0 | 0.525252 | 0.164924 | 0.279545 | 0.399250 | 0.498259 | 0.627641 | 2.129988 |
As we can see above, for second case (all possible pairs) we've got stronger signal in comparison with light-recoil pair as it made in STAR work. Let's build 2d distirbuition and marginals component separately:
First of all let's try to fit
C:\Users\bdrum\Anaconda3\envs\hep\lib\site-packages\lmfit\minimizer.py:857: RuntimeWarning: invalid value encountered in sqrt
  (par.stderr * np.sqrt(self.result.covar[jvar, jvar])))
C:\Users\bdrum\Anaconda3\envs\hep\lib\site-packages\lmfit\minimizer.py:850: RuntimeWarning: invalid value encountered in sqrt
  par.stderr = np.sqrt(self.result.covar[ivar, ivar])


[[Model]]
    (Model(bw, prefix='bw_') + Model(polynomial, prefix='bckg_'))
[[Fit Statistics]]
    # fitting method   = Nelder-Mead
    # function evals   = 766
    # data points      = 50
    # variables        = 9
    chi-square         = 40.7026433
    reduced chi-square = 0.99274740
    Akaike info crit   = 7.71350158
    Bayesian info crit = 24.9217086
##  Warning: uncertainties could not be estimated:
[[Variables]]
    bw_M:     0.76257570 +/- 0.00278473 (0.37%) (init = 0.77)
    bw_G:     0.17054290 +/- 0.00407858 (2.39%) (init = 0.17)
    bw_amp:   220.155833 +/- 0.07016377 (0.03%) (init = 230)
    bckg_c0:  375.237149 +/- 0.33459047 (0.09%) (init = 374.961)
    bckg_c1: -2511.03059 +/- 0.03314420 (0.00%) (init = -2493.255)
    bckg_c2:  7312.39507 +/- 0.03578421 (0.00%) (init = 7288.046)
    bckg_c3: -9574.79936 +/-        nan (nan%) (init = -9558.787)
    bckg_c4:  5677.15511 +/-        nan (nan%) (init = 5664.544)
    bckg_c5: -1250.88619 +/- 0.00275394 (0.00%) (init = -1244.663)
[[Correlations]] (unreported correlations are < 0.100)
    C(bw_G, bckg_c0) = -0.334
C:\Users\bdrum\Anaconda3\envs\hep\lib\site-packages\lmfit\minimizer.py:850: RuntimeWarning: invalid value encountered in sqrt
  par.stderr = np.sqrt(self.result.covar[ivar, ivar])
C:\Users\bdrum\Anaconda3\envs\hep\lib\site-packages\lmfit\minimizer.py:857: RuntimeWarning: invalid value encountered in sqrt
  (par.stderr * np.sqrt(self.result.covar[jvar, jvar])))


[[Model]]
    ((Model(bw, prefix='bw1_') + Model(bw, prefix='bw2_')) + Model(polynomial, prefix='bckg_'))
[[Fit Statistics]]
    # fitting method   = Nelder-Mead
    # function evals   = 1485
    # data points      = 30
    # variables        = 11
    chi-square         = 25.8808301
    reduced chi-square = 1.36214895
    Akaike info crit   = 17.5691549
    Bayesian info crit = 32.9823261
##  Warning: uncertainties could not be estimated:
[[Variables]]
    bw1_M:    1.38115837 +/-        nan (nan%) (init = 1.4)
    bw1_G:    0.26730196 +/-        nan (nan%) (init = 0.2)
    bw1_amp:  115.902720 +/-        nan (nan%) (init = 150)
    bw2_M:    1.58211568 +/-        nan (nan%) (init = 1.55)
    bw2_G:    0.28454224 +/-        nan (nan%) (init = 0.3)
    bw2_amp:  95.5333644 +/-        nan (nan%) (init = 135)
    bckg_c0:  135.876946 +/-        nan (nan%) (init = 159.0529)
    bckg_c1: -531.778166 +/-        nan (nan%) (init = -502.5231)
    bckg_c2:  693.204812 +/- 0.03743163 (0.01%) (init = 626.8528)
    bckg_c3: -341.989204 +/-        nan (nan%) (init = -321.2902)
    bckg_c4:  56.3015457 +/- 0.01892836 (0.03%) (init = 57.279)
Here we would like to study angle decay for
For the sake of simplicity first we will create new lab system with OZ axis directed along momentum of
The transition from original lab frame to the new one could be obtain by two rotation:
- First, around x axis:
Rotation matrix for this case: $$ R_{x,\alpha}= \Bigg( \begin{matrix} 1 & 0 & 0\ 0 & \cos{\alpha} & -\sin{\alpha} \ 0 & \sin{\alpha} & \cos{\alpha} \end{matrix} \Bigg) $$
Rotation angle for x axis:
Now, momentum vector of
- Second, around y axis:
Rotation matrix for this case will looks like $$ R = R_{y,-\beta}= \Bigg( \begin{matrix} \cos{\beta} & 0 & -\sin{\beta}\ 0 & 1 & 0 \ \sin{\beta} & 0 & \cos{\beta} \end{matrix} \Bigg) $$
We have to apply it for already rotated vector around x axis:
$$ \boldsymbol{p''} =R_{y,-\beta}\boldsymbol{p'} = \Bigg( \begin{matrix} \cos{\beta} & 0 & -\sin{\beta}\ 0 & 1 & 0 \ \sin{\beta} & 0 & \cos{\beta} \end{matrix} \Bigg) \Bigg( \begin{matrix} {p'}_x\ {p'}_y\ {p'}_z \end{matrix} \Bigg)
\Bigg( \begin{matrix} {p'}_x\cos{\beta}-{p'}_z\sin{\beta}\ {p'}_y\ {p'}_x\sin{\beta}+{p'}_z\cos{\beta} \end{matrix} \Bigg) $$
Where rotation angle based on the new rotated vector
As a result final transition looks like:
$$ \boldsymbol{p''} = \Bigg( \begin{matrix} {p'}_x\cos{\beta}-{p'}_z\sin{\beta}\ {p'}_y\ {p'}_x\sin{\beta}+{p'}_z\cos{\beta} \end{matrix} \Bigg)= \Bigg( \begin{matrix} p_x\cos{\beta}-p_y\sin{\alpha}\sin{\beta}-p_z\cos{\alpha}\sin{\beta} \ p_y\cos{\alpha}-p_z\sin{\alpha} \ p_x\sin{\beta}+p_y\sin{\alpha}\cos{\beta}+p_z\cos{\alpha}\cos{\beta} \end{matrix} \Bigg) $$ where rotation angles are:
Now let's consider moving coordinate system with
We know components of original momentum of
where $$ \boldsymbol{\beta} = \frac{\boldsymbol{p}}{E} $$ $$ \gamma = \frac{E}{m}$$ $$ \Gamma = \gamma \beta = \frac{p}{m}$$
Now the searched angle can be obtain from scalar multiplication of
$$\cos{\theta}=\frac{\boldsymbol{{p'}{\pi^+}}\boldsymbol{p{\rho_0}}} {{p'}{\pi^+}p{\rho_0}}$$
Let's see to cross section of my events.
For this we should take luminosity of runs.
Unfortunately file that I have to use for getting luminosity have a reference to special class AliTriggerInfo and moreover it packed into TObjArray, so I can't read it via uproot4. This is the reason why I used pure root again. Here is the script that I used.
Then let's see how much events do we have in each run.
Cross section of phenomena should be flat and independent from runs.
Let's check it:
count    117.000000
mean       3.555185
std        1.101315
min        0.716081
25%        2.823498
50%        3.477399
75%        4.276723
max        6.551968
Name: sigma, dtype: float64
In PDG I've seen also other interesting modes for
-
-
$\rho' \rightarrow \eta_0 \rho_0$ | ?
- 1.1.
$\rho_0 \rightarrow 4 \pi$ |$2*10^{-5}%$ - 1.2.
$\rho_0 \rightarrow \pi^+ \pi^-$ |$10^{-2}%$ - 1.3.
$\eta_0' \rightarrow \pi^+ \pi^- \gamma$ |$4%$ - 1.4.
$\eta_0' \rightarrow \pi^+ \pi^- \pi^0$ |$23%$
-
-
-
$\rho' \rightarrow 4 \pi$ | ?
-
What if
