d3 funnel chart for Qlik Sense.
- Move sense-Funnel to the default extension folder in Qlik Sense
- Open Qlik Sense and add the 'Funnel Chart' extension to a sheet
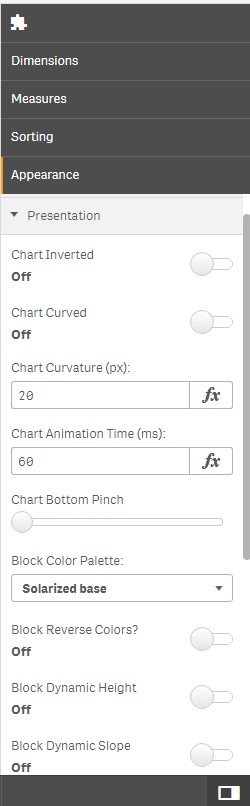
- Configure properties
Google Color Palette Generator https://github.com/google/palette.js/tree/master
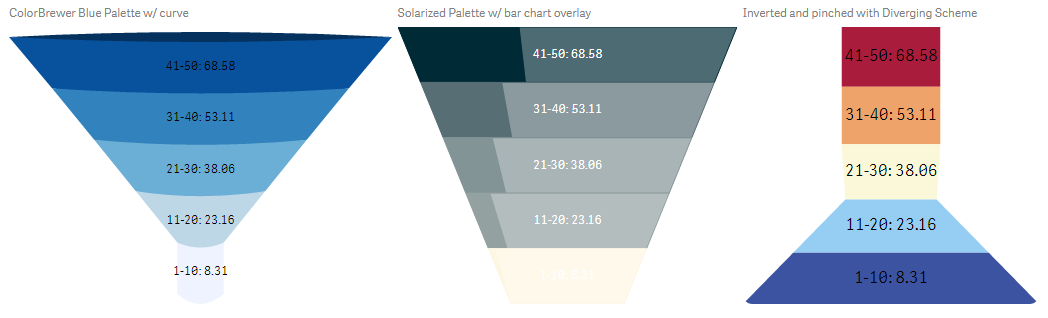
The d3 funnel chart is typically used in scenarios where there are different phases (ex. Lending, Pursuits). Using the dynamic properties for the block, the funnel easily shows the magnitude in change between different phases or steps. Use the dropdown for the color palettes or dive into the js code and change the 'colors' array to any color under the sun. Selections in the UI are also enabled.
- Tested in Qlik Sense June 2018 in IE and Chrome (preferred).
- This extension works best with < 10 distinct values for the dimension chosen. Some color palettes don't support a lot of distinct dimension values.
- Depending on your block property selection(s), the visualization can look a little goofy. Use your best judgement... or fix it :)
MIT