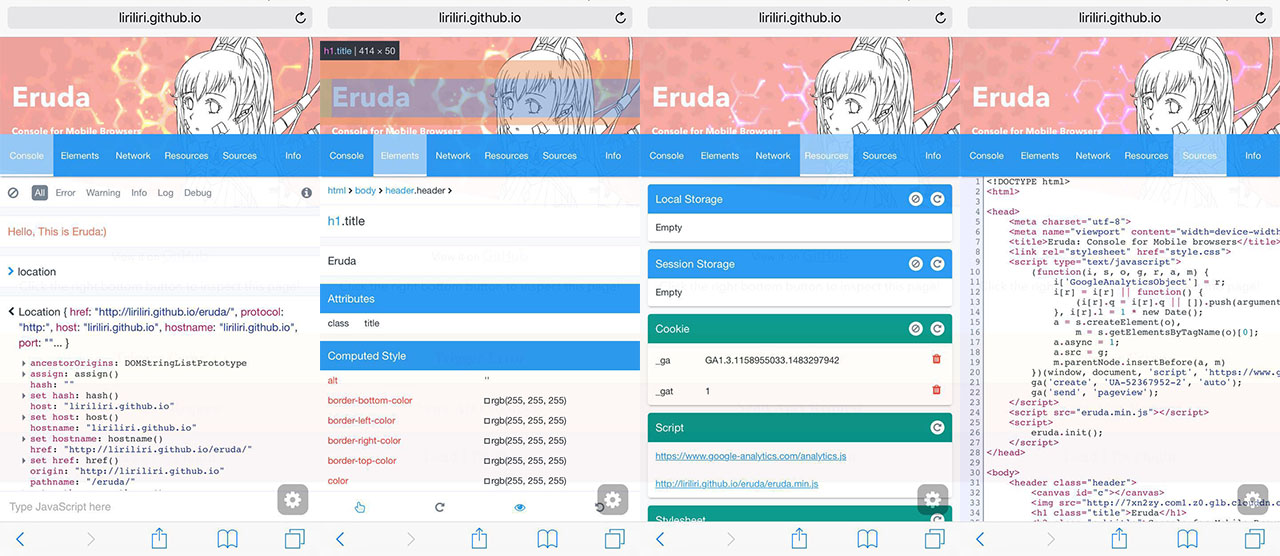
Console for Mobile Browsers.
Logging things out on mobile browser is never an easy stuff. I used to include window onerror alert script inside pages to find out JavaScript errors, kind of stupid and inefficient. Desktop browser DevTools is great, and I wish there is a similar one on mobile side, which leads to the creation of Eruda.
Browse it on your phone: https://eruda.liriliri.io/
In order to try it for different sites, execute the script below on browser address bar.
javascript:(function () { var script = document.createElement('script'); script.src="//cdn.jsdelivr.net/npm/eruda"; document.body.appendChild(script); script.onload = function () { eruda.init() } })();- Console: Display JavaScript logs.
- Elements: Check dom state.
- Network: Show requests status.
- Resource: Show localStorage, cookie information.
- Info: Show url, user agent info.
- Snippets: Include snippets used most often.
- Sources: Html, js, css source viewer.
You can get it on npm.
npm install eruda --saveAdd this script to your page.
<script src="node_modules/eruda/eruda.min.js"></script>
<script>eruda.init();</script>
It's also available on jsDelivr and cdnjs.
<script src="//cdn.jsdelivr.net/npm/eruda"></script>
<script>eruda.init();</script>
The JavaScript file size is quite huge(about 100kb gzipped) and therefore not suitable to include in mobile pages. It's recommended to make sure eruda is loaded only when eruda is set to true on url(https://example.com/?eruda=true), for example:
;(function () {
    var src = 'node_modules/eruda/eruda.min.js';
    if (!/eruda=true/.test(window.location) && localStorage.getItem('active-eruda') != 'true') return;
    document.write('<scr' + 'ipt src="' + src + '"></scr' + 'ipt>');
    document.write('<scr' + 'ipt>eruda.init();</scr' + 'ipt>');
})();When initialization, a configuration object can be passed in.
- container: Container element. If not set, it will append an element directly under html root element.
- tool: Choose which default tools you want, by default all will be added.
For more information, please check the documentation.
let el = document.createElement('div');
document.body.appendChild(el);

eruda.init({
    container: el,
    tool: ['console', 'elements']
});It is possible to enhance Eruda with more features by writing plugins. Check source code of plugins below to learn how to write your own custom tool panels. Besides, eruda-plugin is available for plugin initialization.
- eruda-fps: Display page fps info.
- eruda-features: Browser feature detections.
- eruda-timing: Show performance and resource timing.
- eruda-memory: Display page memory info.
- eruda-code: Run JavaScript code.
- eruda-benchmark: Run JavaScript benchmarks.
- eruda-geolocation: Test geolocation.
- eruda-dom: Navigate dom tree.
- eruda-orientation: Test orientation api.
When writing plugins, you can use utilities exposed by Eruda, see docs here.
- licia: Utility library used by eruda.
- eruda-webpack-plugin: Eruda webpack plugin.
Read Contributing Guide for development setup instructions.

