Lab 3: Azure Application Insights
This lab guide walks the user through a number of management and monitoring solutions within Microsoft Azure. Azure has a wide range of tools available for monitoring your cloud environment, as well as identifying and resolving issues. This lab guide will focus on the following areas:
-
Azure Monitor - a tool for consolidating all monitoring data from Azure services.
-
Log Analytics - a service that ingests log and metric data from Azure services and on-premises infrastructure and offers flexible log search and out-of-the-box analytics.
-
Application Insights - offers application performance monitoring and user analytics through the monitoring of code running on Azure, on-premises or other clouds.
Before proceeding with this lab, please make sure you have fulfilled all of the following prerequisites:
-
A valid subscription to Azure. If you don't currently have a subscription, consider setting up a free trial (https://azure.microsoft.com/en-gb/free/).
-
Access to the Azure CLI 2.0. You can achieve this in one of two ways: either by installing the CLI on your local machine (https://docs.microsoft.com/en-us/cli/azure/install-azure-cli), or by using the built-in Cloud Shell in the Azure portal - you can access this by clicking on the ">_" symbol in the top right corner of the portal.
To begin, you will use an Azure Resource Manager template to build the 'base' lab environment. This template will build the following resources:
- Two Linux and two Windows 2016 Datacenter virtual machines, as well as associated network interfaces;
- A virtual network and one subnet;
- A storage account;
- A log analytics workspace.
To kick off the build process, use the following steps:
1) Open an Azure CLI session, either using a local machine (e.g. Windows 10 Bash shell), or using the Azure portal cloud shell. If you are using a local CLI session, you must log in to Azure using the az login command as follows:
az login
To sign in, use a web browser to open the page https://aka.ms/devicelogin and enter the code XXXXXXXXX to authenticate.
The above command will provide a code as output. Open a browser and navigate to aka.ms/devicelogin to complete the login process.
2) Use the Azure CLI to create a single resource group: monitoring-lab. Use the following CLI command to achieve this:
az group create --name monitoring-lab -l westeurope
Note: the example here shows the location as West Europe, however you are free to deploy this lab into any Azure region.
3) Once the resource group has been deployed, you can deploy the lab environment into this using the pre-defined ARM template. Use the following CLI command to deploy the template.
Important: The log analytics workspace requires a globally unique name, therefore you will need to replace the section "_replace with unique name_" with a globally unique name of your choice. If the name you choose has already been taken, the deployment will fail.
az group deployment create --name monitoring-lab-build -g monitoring-lab --template-file azuredeploy.json --parameters azuredeploy.parameters.json --parameters '{\"logAnalyticsWorkspaceName\":{\"value\":\"_replace with unique name_\"}}'
The ARM template should take around 10 minutes to deploy.
Once the template has finished, let's take a look at the lab environment and what has been deployed. In the Azure portal, navigate to the monitoring-lab resource group as follows:
1) On the left hand menu, click on 'Resource Groups' and then in the right hand pane, click the 'monitoring-lab' resource group.
2) You will see the resources that have been deployed into the resource group. You can use the right hand drop down box to 'group by type' which helps to make the resource list clearer. The list should look as shown in figure 1.
Figure 1: Resource List in the Azure Portal
3) From the resources list, you can see that four virtual machines have been deployed (named Monitoring-VM-1 to 4). You'll also see corresponding network interfaces, disks and public IP addresses for each VM. The resource group also contains a storage account and virtual network. Finally, you'll be able to see the log analytics workspace, using the name you gave in the parameters when running the az group deployment create command.
Now that we have our resources, let's start by looking at what is possible using the Azure Monitor tool. Azure Monitor is a feature that provides central monitoring of most Azure services and resources, designed to give you infrastructure level diagnostics and logs about a service and the surrounding environment.
Start by navigating to the Azure Monitor page:
1) In the Azure portal, click on Monitor on the left hand menu.
2) To begin, you'll see a splash screen showing options for monitoring essentials, advanced analytics and monitoring solutions.
3) Click on 'Subscription Summary' on the left hand menu. This will take you to a summary page where you can see information about monitoring in your subscription, such as the number of alerts fired, activity log errors and Azure service health, as shown in figure 2.
Figure 2: Azure Monitor - Subscription Summary View
4) Under 'Service Health', click on 'Service Issues'. This will take you to the Azure Service Health page, where you are able to view any service issues with the Azure platform (hopefully no issues are shown!).
5) Click on 'Health History' from the left hand menu. From here, you can see any historical issues with the Azure Platform - this can help to diagnose unexplained issues with any Azure resources that you may have experienced.
6) Click on 'Health Alerts' from the left hand menu and then '+ Create Service Health Alert'. From here, you are able to create an alert to take some action in the event of any Azure Service experiencing an issue. For example, you could create an alert to take action in the event of an issue with the Azure Event Hub service in the Central US region. Clicking on the 'Action Type' drop down box at the bottom of the screen, you can see that it is possible to send a notification, trigger an Azure Function or Logic App, as well as triggering an automation runbook.
7) Do not create a Service Health alert - close the dialog box and then return to the main Azure Monitor page by selecting 'Monitor' from the left hand side of the screen.
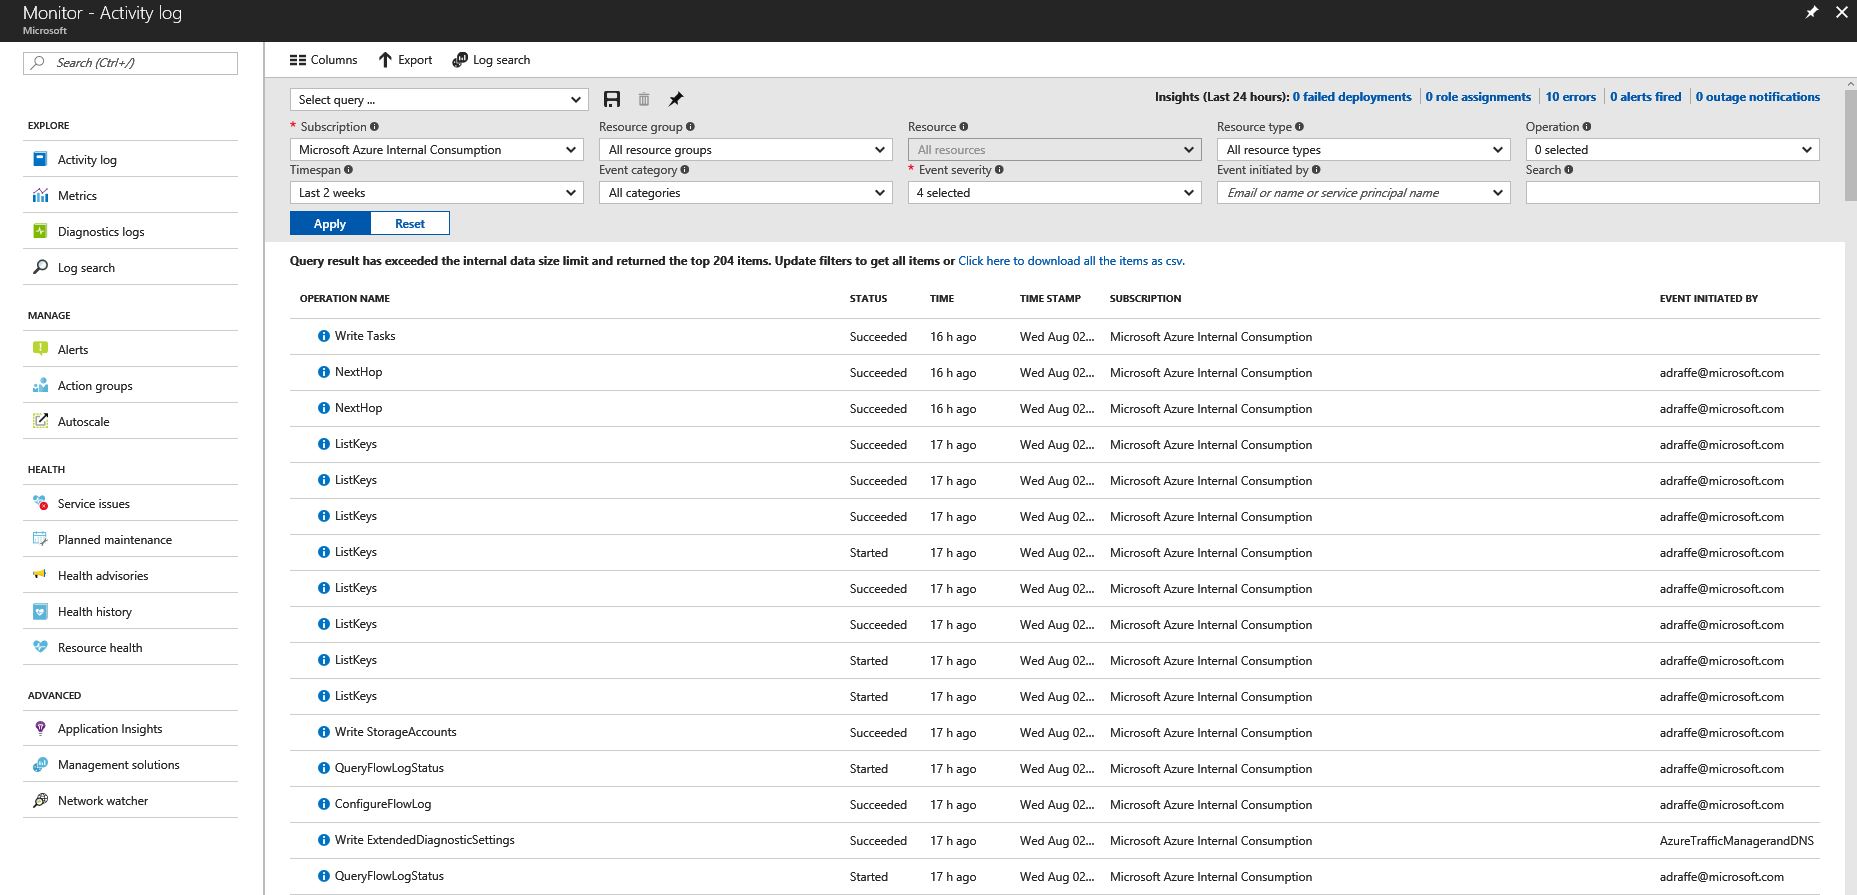
8) Select 'Activity Log' from the left hand menu. This shows a filterable view of all activity in your subscription - you can filter based on timespan, event severity, resource type and operation. Modify some of the filter fields in this screen to narrow down the search criteria.
Figure 2: Azure Monitor - Subscription Summary View
Now that we've spent some time exploring Azure Monitor, let's look at some of the metric and alerting capabilities that are available.
1) In the Azure Monitor menu on the left, select 'Metrics (Preview)'. In the 'resource' box at the top of the screen, search for 'monitoring' and then select the 'Monitoring-VM-1' virtual machine in the drop-down menu. Select 'host' as the sub-service and then 'Percentage CPU' as the metric.
Figure 3: Azure Monitor - CPU Metrics
2) For all types of metric displayed, it is possible to configure alerts when a specific threshold is reached. Select 'Alerts' from the left hand menu and then click on 'New Alert Rule' at the top of the screen.
3) Click on 'Select Target' and then choose your subscription. Select 'Virtual Machines' as the resource type and then choose 'Monitoring-VM-1'.
4) Click on 'Add Criteria' and then select 'Percentage CPU' as the signal type.
5) Under 'Alert Logic', ensure the condition is 'Greater than' and set the threshold to 40%. Change the period to 'Over the last 1 minute'.
6) Expand the section named 'Define Alert Details'. Name the alert rule 'alert-cpu' and give it a suitable description. Click OK.
7) Expand the section named 'Define Action Group'. Name the action group 'alert-email' (use this for the short name as well). Under 'Actions', use the same name and select 'Email/SMS/Push/Voice'. In the resulting dialog box, configure your own email address. Select OK.
8) On the main page, click 'Select Action Group' and select the group you have just configured.
9) Execute the following CLI command to list the public IP addresses of your virtual machines:
az network public-ip list -g monitoring-lab --query "[*].{Name:name,IP:ipAddress}" -o table
10) SSH to your Monitoring-VM-1 virtual machine using 'ssh labuser@public-ip'. The password for all virtual machines is M1crosoft123.
11) Install the 'Stress' tool on the virtual machine:
sudo apt-get install stress
12) Use the Stress program to hog the CPU:
stress -c 50
stress: info: [61727] dispatching hogs: 50 cpu, 0 io, 0 vm, 0 hdd
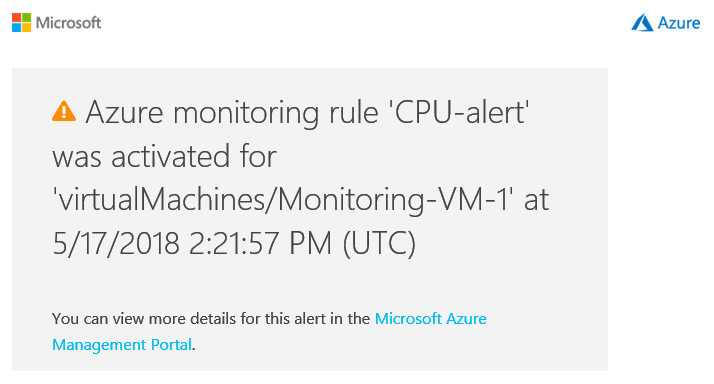
13) After approximately 5 minutes, you should receive an email alerting you to the high CPU on your VM:
Figure 4: Azure Monitor - Email Alert
14) Stop the Stress program using 'CTRL-C'. After another few minutes you should receive another mail informing you that the CPU percentage has reduced.
In this section, we'll configure another alert rule - this time, instead of sending an email, the rule will trigger an Azure Automation runbook that will automatically shut down the virtual machine when the CPU reaches a certain threshold. Clearly in most cases this would not be a real world scenario, however it serves to show what can be achieved using Azure Monitor in conjunction with automation.
1) In Azure Monitor, select 'Alerts' from the left hand menu and then click on 'New Alert Rule' at the top of the screen.
2) Click on 'Select Target' and then choose your subscription. Select 'Virtual Machines' as the resource type and then choose 'Monitoring-VM-1'.
3) Click on 'Add Criteria' and then select 'Percentage CPU' as the signal type.
4) Under 'Alert Logic', ensure the condition is 'Greater than' and set the threshold to 40%. Change the period to 'Over the last 1 minute'.
5) Expand the section named 'Define Alert Details'. Name the alert rule 'alert-shutdown' and give it a suitable description. Click OK.
6) Expand the section named 'Define Action Group'. Name the action group 'alert-shutdown' (use 'shutdown' for the short name). Set the resource group to 'monitoring-lab'. Under 'Actions', use the same name and select 'Automation Runbook'. In the resulting dialog box, choose 'Stop VM' under the Runbook drop down menu.
7) Choose your subscription and then under the 'Automation Account' drop down menu, select '+ New'. Create a new automation account called 'monitoring-automation' in the 'monitoring-lab' resource group (ensure the region is the same as previously used). Choose OK for all open dialog boxes. The screen should look as shown in figure 5.
Figure 4: Azure Monitor - Shutdown Alert
8) Click 'Create Alert Rule'.
9) Once again, SSH into the virtual machine named 'Monitoring-VM-1' and use the Stress program to hog the CPU:
stress -c 50
stress: info: [61727] dispatching hogs: 50 cpu, 0 io, 0 vm, 0 hdd
10) Within 5 minutes or so, the VM should automatically shut down. Check this by select 'Virtual Machines' from the left hand menu in the portal and view the status of 'Monitoring-VM-1'.
10) Select the 'Monitoring-VM-1' virtual machine and start it.
The first thing we'll do in this section is to connect our resources to the log analytics instance within our resource group. To do this, navigate to the monitoring-lab resource group and then click on the log analytics workspace created using the ARM template (the unique name was chosen earlier by you). Now, follow the steps below to connect your virtual machines:
1) On the left hand menu under Workspace Data Sources, click on 'Virtual Machines'. You should see the four 'monitoring' VMs created earlier (plus any other VMs you may have). These VMs should show as Not Connected, although they may show as being connected to Other Workspace.
2) Click on each of the four VMs in turn and click on 'Connect' - if the VM shows as connected to another worspace, disconnect it first. After some time, you should see all VMs connected to the workspace, similar to figure 1:
Figure 1: Connecting Virtual Machines to Log Analytics
The process of connecting virtual machines to the log analytics workspace automatically installs a log analytics extension agent on each virtual machine and configures it to talk to your workspace.
Next, we'll connect the Azure Activity Log to our log analytics workspace. The Activity Log provides an audit trail for activities carried out in the Azure Resource Manager. Any write operations performed in your environment are logged using this feature. To connect the Activity Log to your log analytics workspace, use the following steps:
1) On the left hand menu under Workspace Data Sources, click on 'Azure Activity Log'. Select your subscription and then click 'Connect'. You should now see your subscription showing connected, as shown in figure 2:
Figure 2: Connecting the Azure Activity Log to Log Analytics
Once this is complete, we'll configure Log Analytics to collect event and performance data from our Linux and Windows VMs. To configure this, complete the following steps:
1) Under the Log Analytics workspace, click on 'Advanced Settings'. In this window, you'll see 'Connected Sources', 'Data' and 'Computer Groups'. Click on 'Data'.
Note: I have found that I sometimes can't access this area of the Azure portal using the Chrome browser. If this is the case for you, please try another browser (Microsoft Edge seems to work).
2) Under 'Windows Event Logs', type 'System' in the search box and add then the '+' sign to add this event log.
3) Under 'Windows Performance Counters', click the button entitled 'Add the Selected Performance Counters'. This will add a set of suggested counters for the Windows machines.
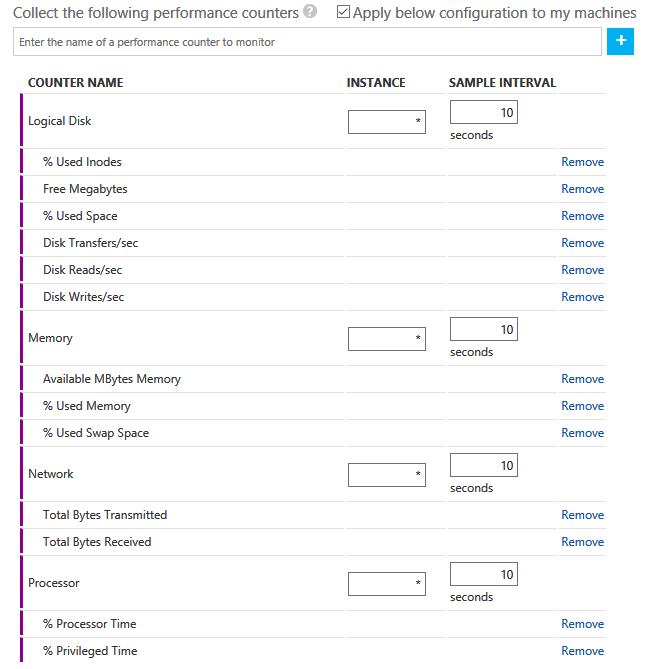
4) Under 'Linux Perfomance Counters', check the box entitled 'Apply below configuration to my machines' and then select 'Add the Selected Performance Counters'. This will add a set of suggested performance counters for the Linux machines.
Figure 3: Adding Linux Performance Counters to Log Analytics
5) Click on 'Syslog' and then select 'Apply below configuration to my machines'. Type in 'kern' and then the '+' sign to add. Type in 'auth' and again, click the '+' sign.
Figure 4: Adding Syslog Collection to Log Analytics
6) Finally, click 'Save' at the top of the page to save the configuration.
A Solution in Azure Log Analytics is a collection of rules and logic that provides metrics focused around a particular problem area. Although not required for log search functionality, a Solution provides data visualisation, suggested searches and additional insights for the area in question.
In this section, we'll add a number of Solutions to our Log Analytics workspace, such as Change Tracking, Update Management and Azure Activity Logs.
To add solutions to the Log Analytics workspace, use the following steps:
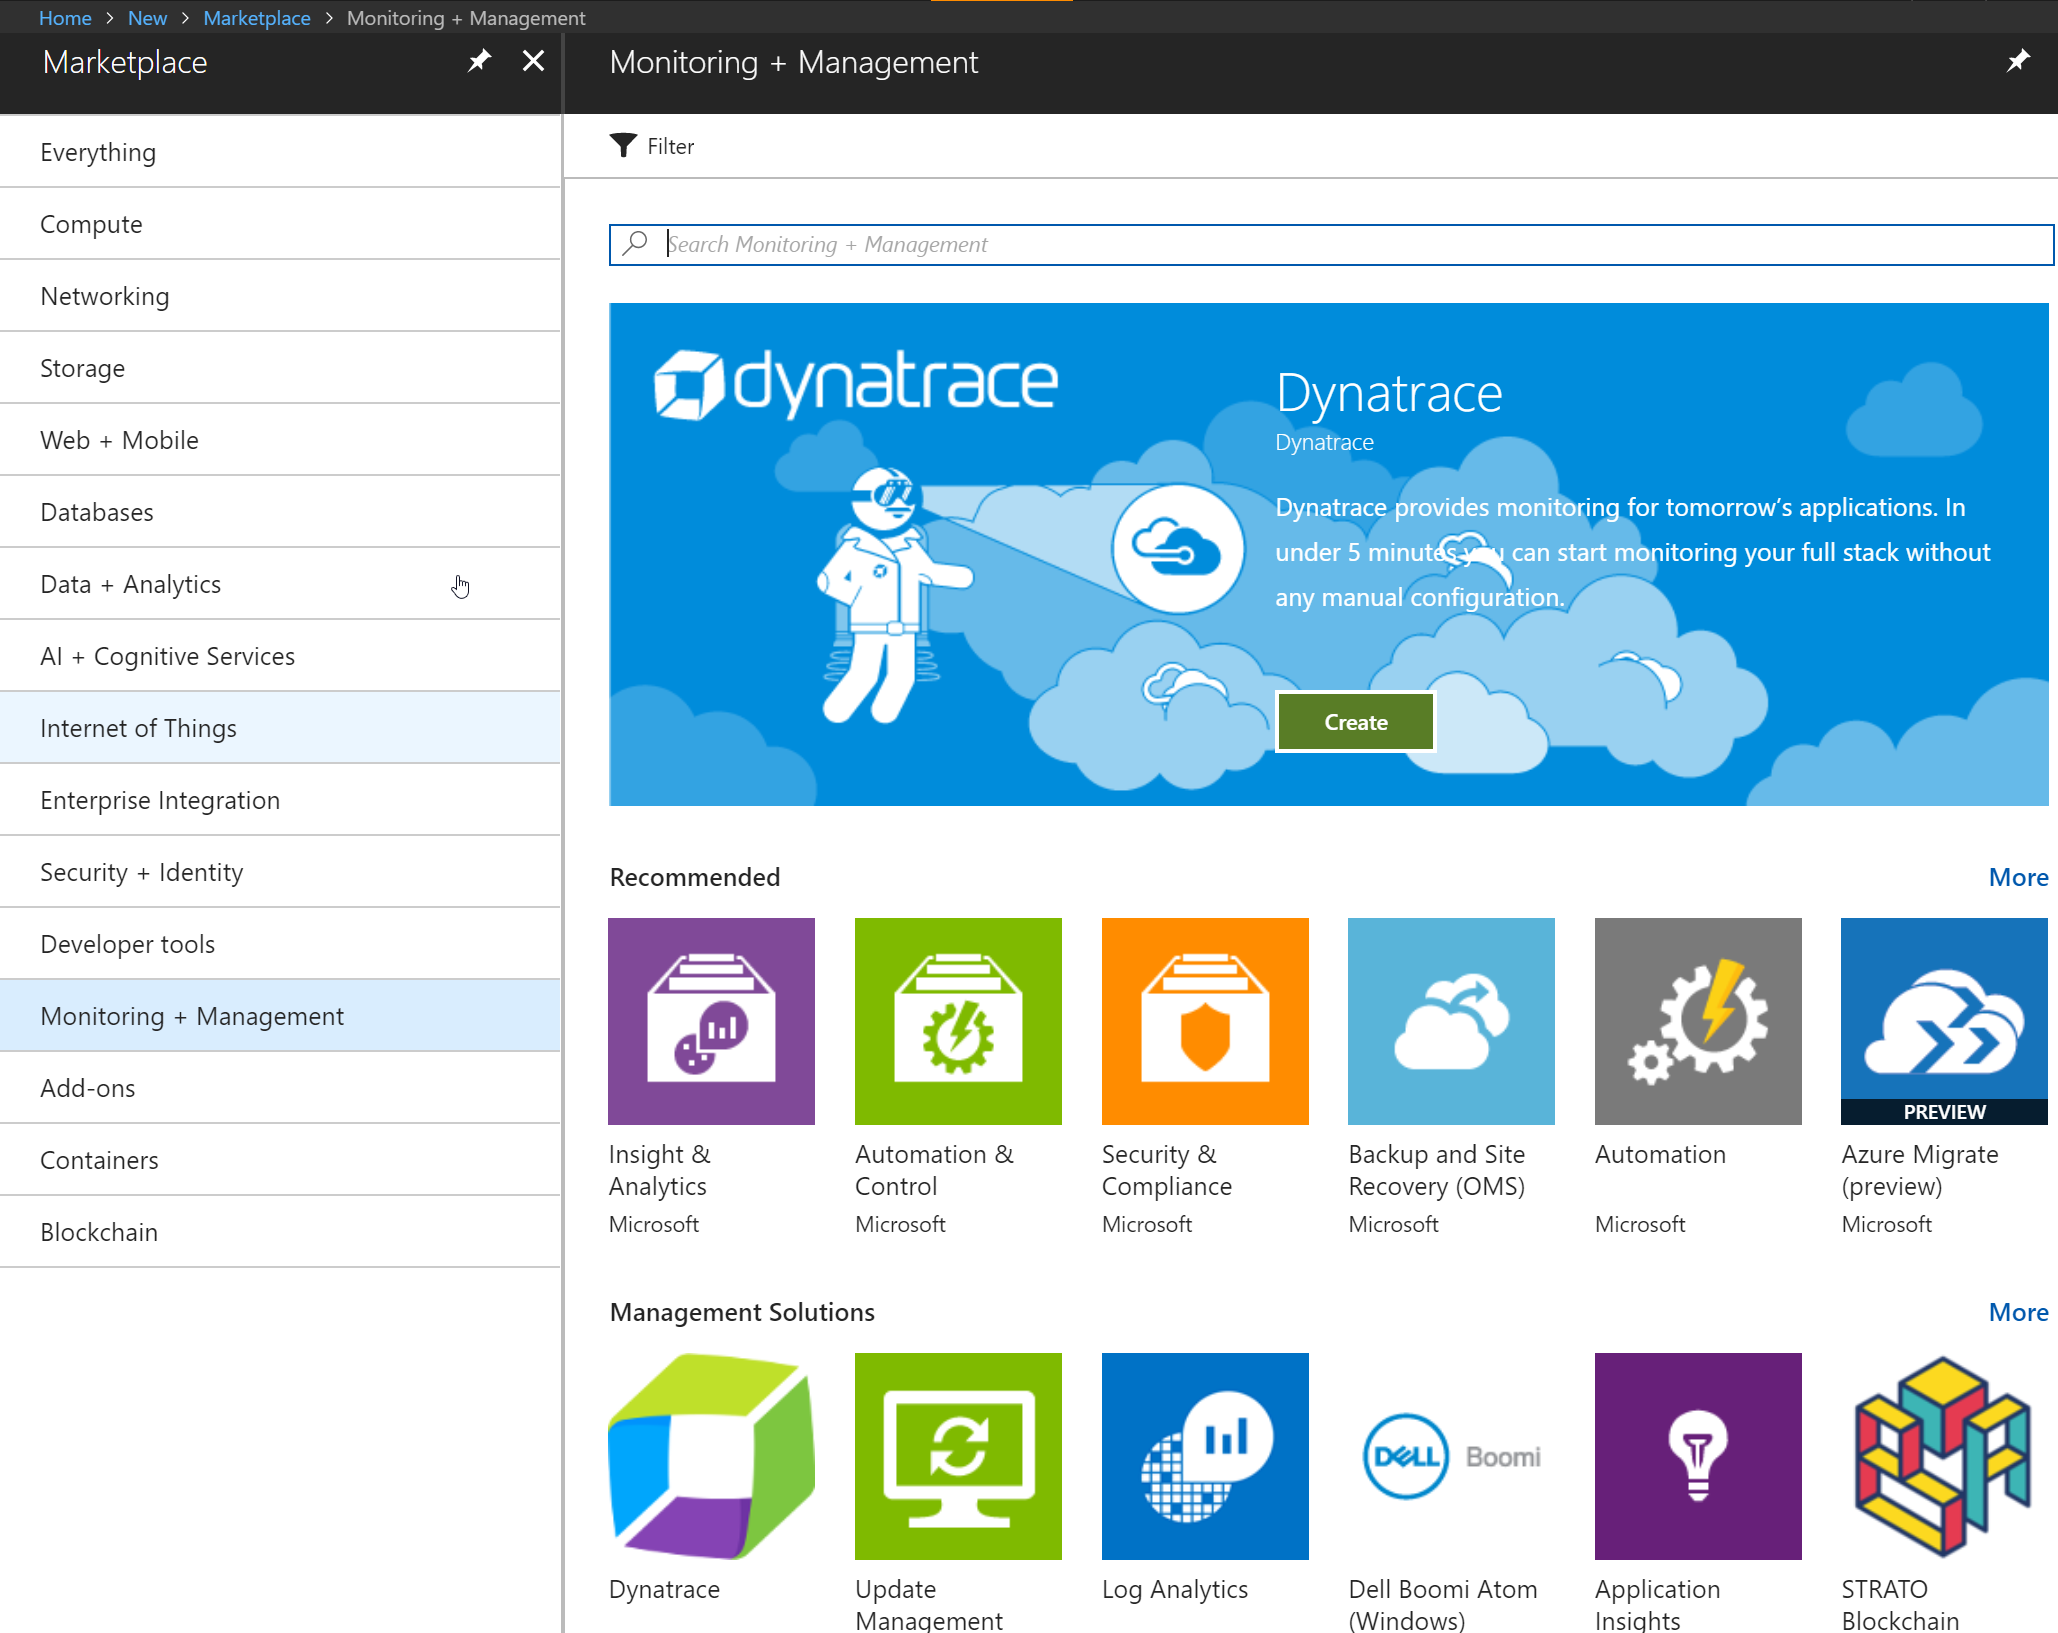
1) In the Azure portal, click the '+' sign in the top left to create a new resource and then select 'Monitoring + Management'. Click 'See All'.
Figure 5: Adding a Solution to Log Analytics
2) Search for 'Update Management' and then select the item and click 'Create'. Under 'OMS Workspace', select your Log Analytics workspace.
3) Under 'OMS Workspace Settings', make sure the resource group 'monitoring-lab' is selected and then create a new automation account named 'logAnalyticsAutomation'.
4) Repeat this process and add the following Solutions to your workspace:
- Activity Log Analytics
- Change Tracking
- Security and Compliance
5) Verify that the solutions have been added correctly by navigating to your Log Analytics workspace and then selecting 'Solutions' from the menu, as shown in figure 6:
Figure 6: Listing Log Analytics Solutions


