An example repository for demonstrating xDS load-balancer for Go gRPC client in a kubernetes cluster. If you are unfamiliar with the xDS protocol or the Golang client, please check the References section below.
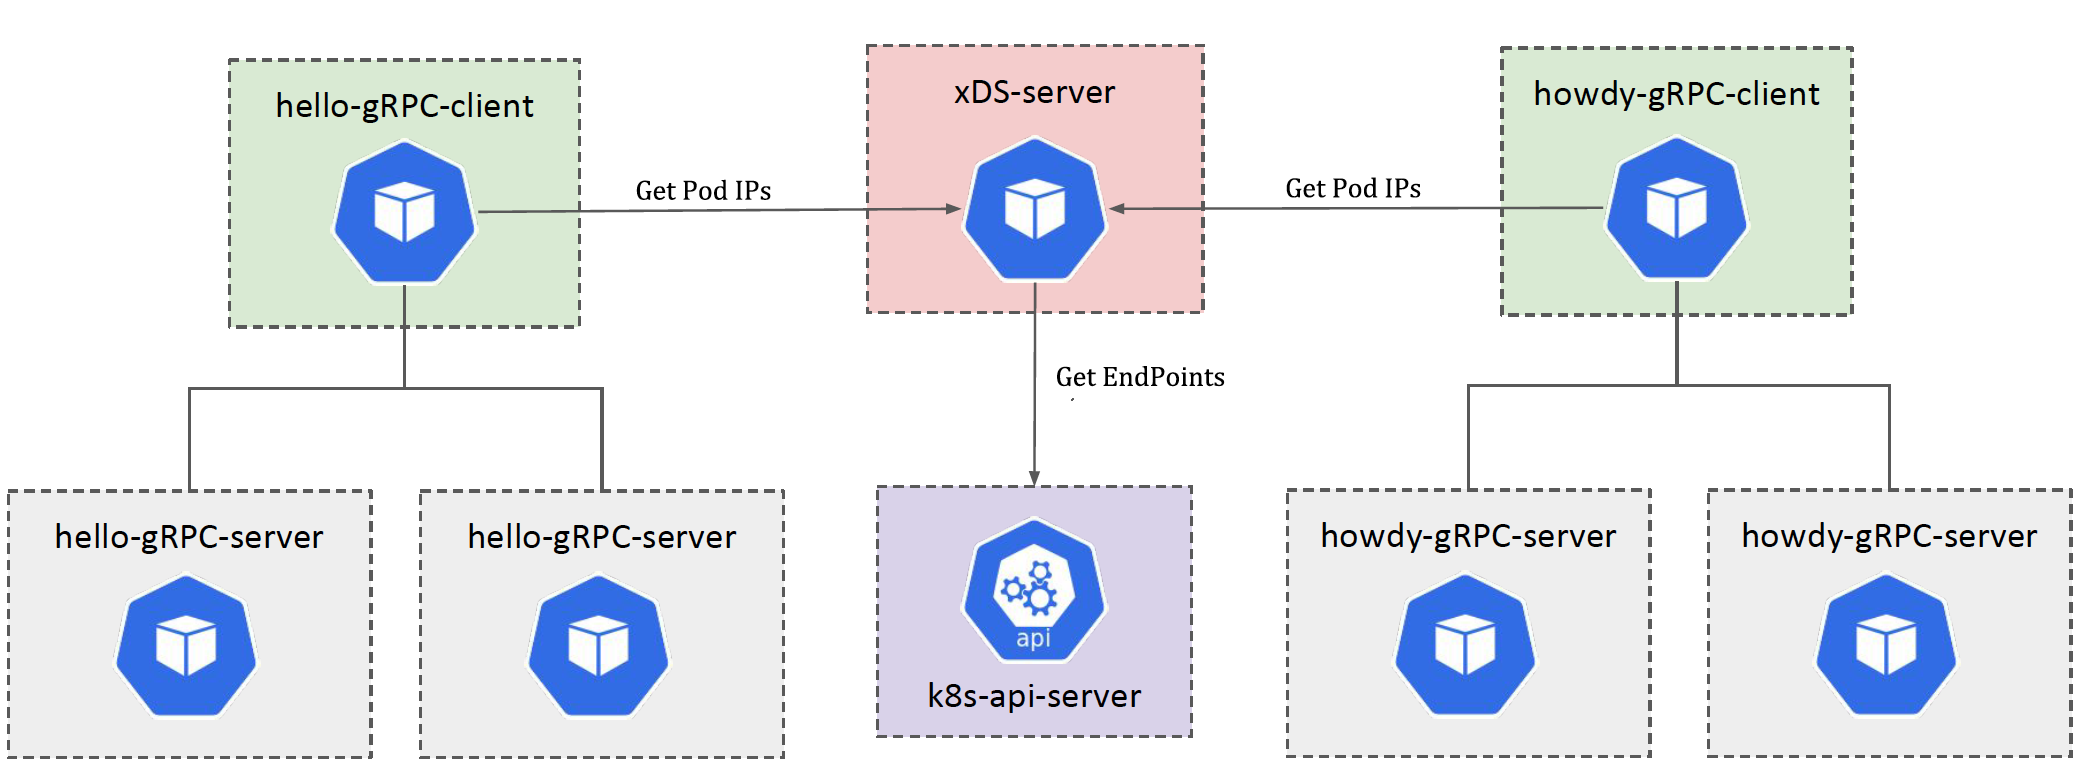
In this example application, I am using two gRPC services (hello and howdy) and clients connecting to those in a load-balanced way. The below diagram shows the setup.
xDS server discovering the target kubernetes service endpoints using kubernetes APIs. Check the getK8sEndPoints function.
Below, software/tools are required to run the demo.
- homebrew
- A k8s cluster. The example is tested with k3d Install k3d using
brew install k3d - Protobuf -
brew install protobuf - Go task (trust me it will reduce the keystrokes!)
brew install go-task/tap/go-task
To test the repository quickly, I am going to run all commands via Go Task. You can look into the all commands in the Taskfile.yml (or Taskfile-*.yml files.
Start Docker and then run task k3d:start. This creates a three-node kubernetes cluster.
Run kubectl cluster-info and check the cluster is up and running.
Additionally, confirm the nodes are running using kubectl get nodes command. Sample output below.
NAME                 STATUS   ROLES    AGE   VERSION
k3d-local-agent-1    Ready    <none>   14d   v1.18.8+k3s1
k3d-local-agent-0    Ready    <none>   14d   v1.18.8+k3s1
k3d-local-server-0 Ready master 14d v1.18.8+k3s1- Build xDS Server
task xds:build - Deploy xDS Server
task xds:deploy
You can run above in a single command task xds:build xds:deploy
- Build gRPC Server
task server:build - Deploy gRPC Server
task server:deploy
You can run above in a single command task server:build server:deploy
- Build gRPC Client
task client:build - Deploy gRPC Client
task client:deploy
You can run above in a single command task client:build client:deploy
Check all the components are running.
Run kubectl get deployments.apps to check all deployments. You must see five deployments in the list.
NAME           READY   UP-TO-DATE   AVAILABLE   AGE
hello-client   1/1     1            1           4d23h
howdy-client   1/1     1            1           4d23h
hello-server   2/2     2            2           4d23h
howdy-server   2/2     2            2           4d23h
xds-server     1/1     1            1           5d
Run kubectl get svc to check all services. You must see four services on the list.
NAME           TYPE        CLUSTER-IP      EXTERNAL-IP   PORT(S)     AGE
kubernetes     ClusterIP   10.43.0.1       <none>        443/TCP     14d
xds-server     ClusterIP   10.43.113.60    <none>        18000/TCP   5d
hello-server   ClusterIP   10.43.78.196    <none>        50051/TCP   4d23h
howdy-server   ClusterIP   10.43.228.201   <none>        50052/TCP   4d23h
Run kubectl get pods to check all pods. You must see seven pods on the list. The pod suffix (after the last -) is going to be different each time.
NAME                            READY   STATUS    RESTARTS   AGE
howdy-client-659b8f99f5-q6fvx   1/1     Running   1          4d23h
hello-client-5f7bdc5f68-2vkfs   1/1     Running   1          4d23h
xds-server-86c5f6bfcf-f8wks     1/1     Running   1          5d
hello-server-b9ff98f5b-cgvk7    1/1     Running   1          4d23h
howdy-server-7d79c584f6-xbv4l   1/1     Running   1          4d23h
hello-server-b9ff98f5b-l7dmc    1/1     Running   1          4d23h
howdy-server-7d79c584f6-d54zs 1/1 Running 1 4d23hThe server responds to the gRPC requests in the code by adding the server host IP. We can use this to identify the target server responding to the client request.
Let's check the logs from hello client by running kubectl logs -f deployment/hello-client
There are two essential things in the logs.
You can see logs initiating connections with the xDS server and getting the server's xDS protocol response. This is the point where the client-side load balancer picks the available connections.
Example response
INFO: 2020/09/07 01:31:28 [xds] [eds-lb 0xc0002ce820] Watch update from xds-client 0xc0001502a0, content: {Drops:[] Localities:[{Endpoints:[{Address:10.42.0.234:50052 HealthStatus:1 Weight:0} {Address:10.42.1.138:50052 HealthStatus:1 Weight:0}] ID:my-region-my-zone- Priority:0 Weight:1000}]}You can see the gRPC server responding to the client requests. Using the IP address in the gRPC response, you can see that the response comes from both replicas of hello-grpc-server apps.
Example response
{"level":"info","caller":"client/client.go:51","msg":"Hello Response","Response":"message:\"Hello gRPC Proxyless LB from host howdy-server-7d79c584f6-xbv4l\""}
{"level":"info","caller":"client/client.go:51","msg":"Hello Response","Response":"message:\"Hello gRPC Proxyless LB from host howdy-server-7d79c584f6-d54zs\""}
{"level":"info","caller":"client/client.go:51","msg":"Hello Response","Response":"message:\"Hello gRPC Proxyless LB from host howdy-server-7d79c584f6-xbv4l\""}
{"level":"info","caller":"client/client.go:51","msg":"Hello Response","Response":"message:\"Hello gRPC Proxyless LB from host howdy-server-7d79c584f6-d54zs\""}
Similarly, you can check the howdy-client logs kubectl logs -f deployment/howdy-client
Here is the diagram representing, whole setup.
What about scaling the deployments? You can scale (up and down) the gRPC server (both hello and howdy) and see how the xDS load balancing will behave. It may take up to a minute for the client to pick up the changes.
kubectl scale --replicas=5 deployments.apps/hello-server
kubectl scale --replicas=5 deployments.apps/howdy-server
Remove all the components using task remove command.
Remove the k3dcluster using task k3d:delete command. Alternatively, stop the k3d cluster using task k3d:stop
- https://www.envoyproxy.io/docs/envoy/latest/api-docs/xds_protocol
- https://github.com/grpc/proposal/blob/master/A27-xds-global-load-balancing.md
- https://github.com/envoyproxy/data-plane-api/tree/master/envoy/api/v2
- https://github.com/grpc/grpc-go/blob/master/examples/features/xds/README.md
- envoyproxy/go-control-plane#349
- https://medium.com/@salmaan.rashid/grpc-xds-loadbalancing-a05f8bd754b8

