Skip to content

Interactive Dorling Cartogram of US state population and income data using D3.js

Notifications You must be signed in to change notification settings

anthonyblackham/usa-cartogram-dataviz


Folders and files

NameName
Last commit message
Last commit date

Latest commit


History

13 Commits


Repository files navigation

usa-cartogram-dataviz

Overview

Dorling Cartogram of US State population and income data using D3.js

In the /data directory, GeoJSON provides state centroid data and US Census dataset provides population/income data.

Usage

To interact with this visualization, clone the repo and run a webserver in it, for example:

python -m SimpleHTTPServer

or, for python3:

python -m http.server 
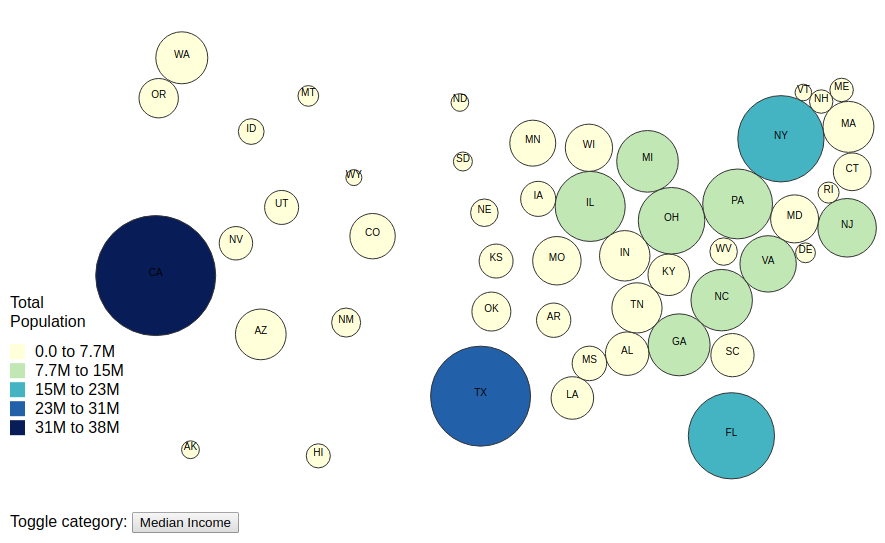
Images

Total Population

Median Income

About

Interactive Dorling Cartogram of US state population and income data using D3.js

Resources

Stars

Watchers

Forks

Releases

No releases published

Packages

No packages published

Languages

  • JavaScript 92.2%
  • HTML 7.8%