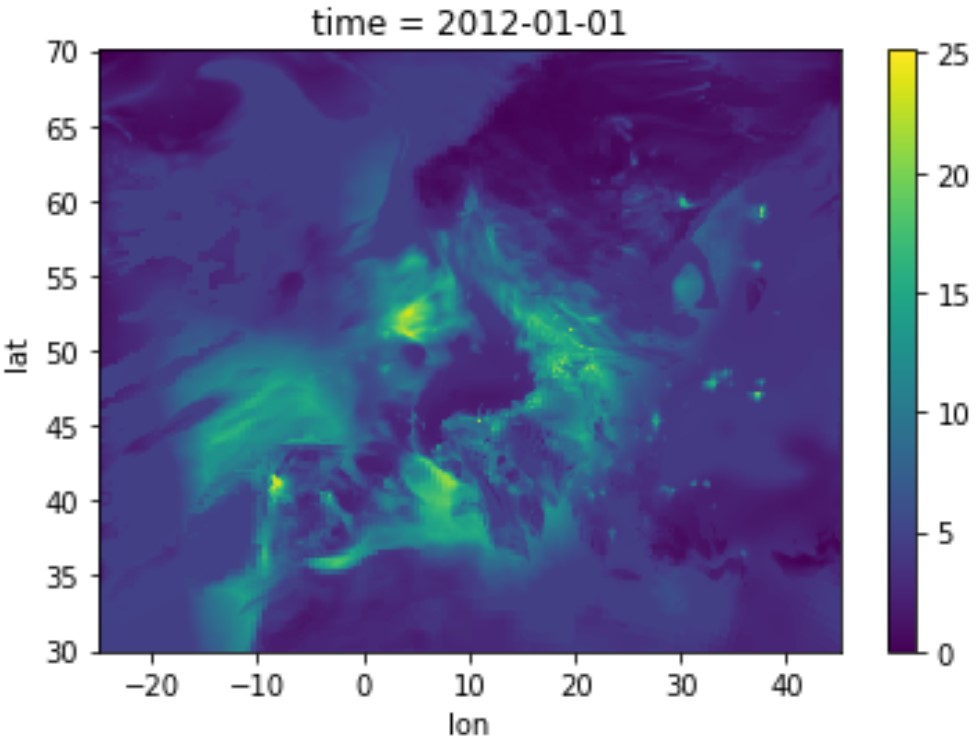
to find out which places in Europe were characterized by exceedingly high PM10 concentration levels
- Copercnicus Atmospheric Monitoring Service (CAMS) hourly data on PM10 concentration levels available at: https://www.regional.atmosphere.copernicus.eu/?category=data_access (later moved to: https://ads.atmosphere.copernicus.eu/cdsapp#!/dataset/cams-europe-air-quality-reanalyses?tab=overview)
Europe, year of 2012
- Initial preparation
- Familiarinig with the data
- Transforming the type of 'time' variable
- Aggregating hourly data to create a daily product
- Calculating the number of days characterized by exceedingly high PM10 values, for each place (pixel) in Europe
- Saving the result as a TIFF file using GDAL
Prepared by: Aleksandra Radecka
e-mail: [email protected]
LinkedIn: https://www.linkedin.com/in/aleksandraradecka/
