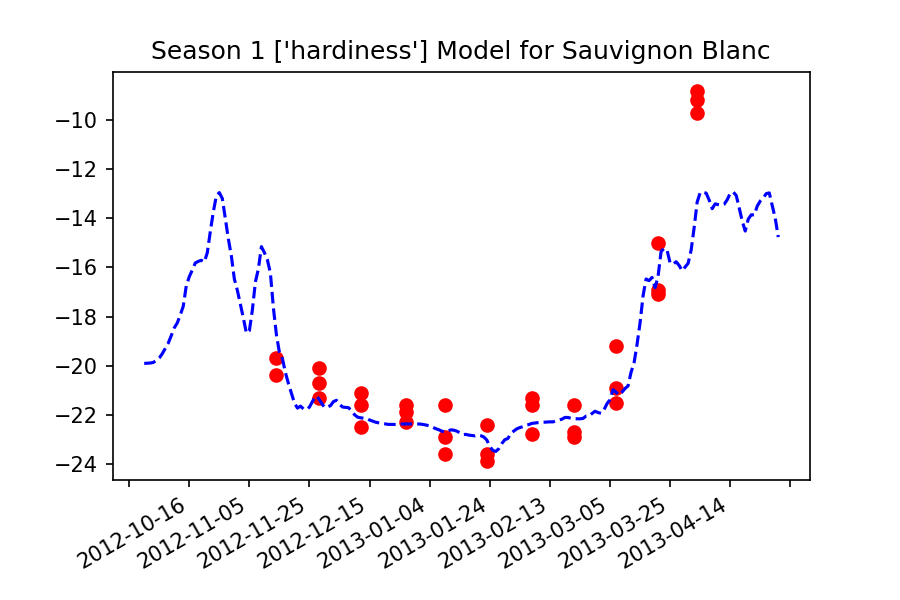
Predicting grapevine cold hardiness in the Okanagan Valley, BC using data from 2012 - 2018 from multiple sites and varieties. Two modeling methods were used. The first was to train an SVR with a nonlinear 'rbf' kernel. The second method was to fit a linear Bayesian model. These two models did not have the same inputs or outputs. The SVR model predicted the absolute hardiness on a given day based on the maximum average temperature of the previous 14 days. The Bayesian model predicted the change in hardiness based on the change in Growing Degree Days over 5C (GDD5) from a sample at time, t, and the previous sample before that, t-1.
deacclimation.RDetailed visualizations of what the 'deacclimation' phase and the filter that determined it.model_4.RCreated a linear model using the change in GDD > 5 between two sample dates to predict the change in hardinesssimulation_gdd_hardiness_delta.RThe accompanying simulation formodel_4.Rand it's real data.
-
SVR_sauv_blanc_all_sites.py
- Trained SVR with an 'rbf' kernel
- model tries to predict the true hardiness of a grapevine given the average temperature from the previous 14 days
- data was split into a test and train set
- Test: Seasons 3 and 6 (2014-2015 and 2017-2018)
- Train: Seasons 1, 2, 4, 5, 7
- data is completely pooled by site
- model input is average maximum temperature of the previous 14 days
-
SVR_sauv_blanc_oliver_east.py
- Same model and setup as the SVR file above, but this was trained and tested on data only from Oliver, East
- Validation Years
- Training Years
- Stores all the python scripts which clean, manipulate, alter data in any form.
- Generally saves the data manipulations into ./data
hardiness_cleaning_X.pyrun them in order to get the 'immutable' cleaned hardiness filehardiness_manipulation.pycalculates the delta hardiness from ../data/data_and_weather.csvweather_manipulation.pysummarizes data between sample dates into one statistic for each metric if any new inputs or parameters want to be tested, do it in hereweather_manipulation_validation.pngDid one set of the summary stats manually in excel to validate everything was working correctly. Probably doesn't need to be updated as this just proves the data_between_dates is working.
- Data that was created from the ./scripts directory OR was inhereted by another source (cleaned Penticton weather)
hardiness_cleaned.csvshould be treated as immutable. Do not write to this file unless tested well in the '/scripts/hardiness_cleaning_X.py' filesmodel_train.csvcontains all the current weather parameters comparing to hardiness and the change in hardiness between timestepspenticton_weather_data.csvis the inhereted source for weather data from the Penticton Weather Station. TODO: clean the uncleaned penticton weather data to get wind and other metrics that were left out of this datapenticton_weather_data_v1.csvused this for some reason in the interactive plot in ./viz so I decided to keep it instead of dealing with it :)/hardiness_carls_modelcontains the data from Carl's hardiness model/hardiness_originalcontains the original files that are treated as immutable. Used to createmodel_train.csvtargets.csvcontains the target values for model training
weather_hardiness_interactive.pyinteractive visualization for weather & hardiness. Could definitely be updated to make more useful./hardinesscontains plots of hardiness to visualize the data as a time series/hardiness_deltasame idea as/hardinessbut the change in hardiness is visualized/final_presentationcontains all the plots that were included for the final presentation of FRST 507c
I know it's still a bit spaghetty-y (??) but gotta have a trade off for dev time sometimes
- start with the 'scripts/hardiness_cleaning_X.py' files to see how data is concatentated, cleaned, etc.
- run 'scripts/weather_manipulation.py'
- run 'scripts/hardiness_manipulation.py'
- Environment Canada Instructions for getting Penticton Weather Station Data: https://drive.google.com/drive/folders/160ZGld_zZrqju29GFk2PVAerIeVxKotn
Cygwin query: for year in `seq 2012 2022`;do for month in `seq 1 1`;do wget --content-disposition "https://climate.weather.gc.ca/climate_data/bulk_data_e.html?format=csv&stationID=50269&Year=${year}&Month=${month}&Day=14&timeframe=2&submit= Download+Data" ;done;done


