In this repository we explore data found on Kaggle.com. The data consists of three datasets and we opted to focus on two:
- Listings by date: calendar.csv
- Description of listings: listings.csv
The libraries used in this repository are:
- pandas
- numpy
- matplotlib
- seaborn
- PIL
- wordcloud
- os
- vaderSentiment
Our objective is to look at listings through the landlord's perspective. The decision to post a listing on Airbnb comes with risks and benefits to the user, we therefore seek to address the following three questions:
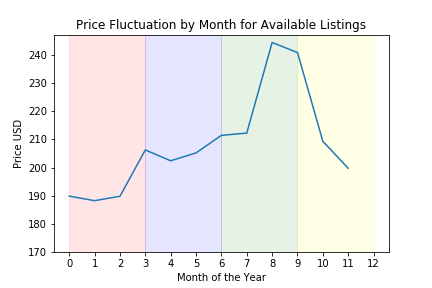
- How do prices vary by date?
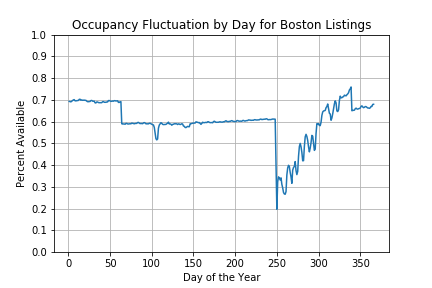
- How long do rentals stay empty?
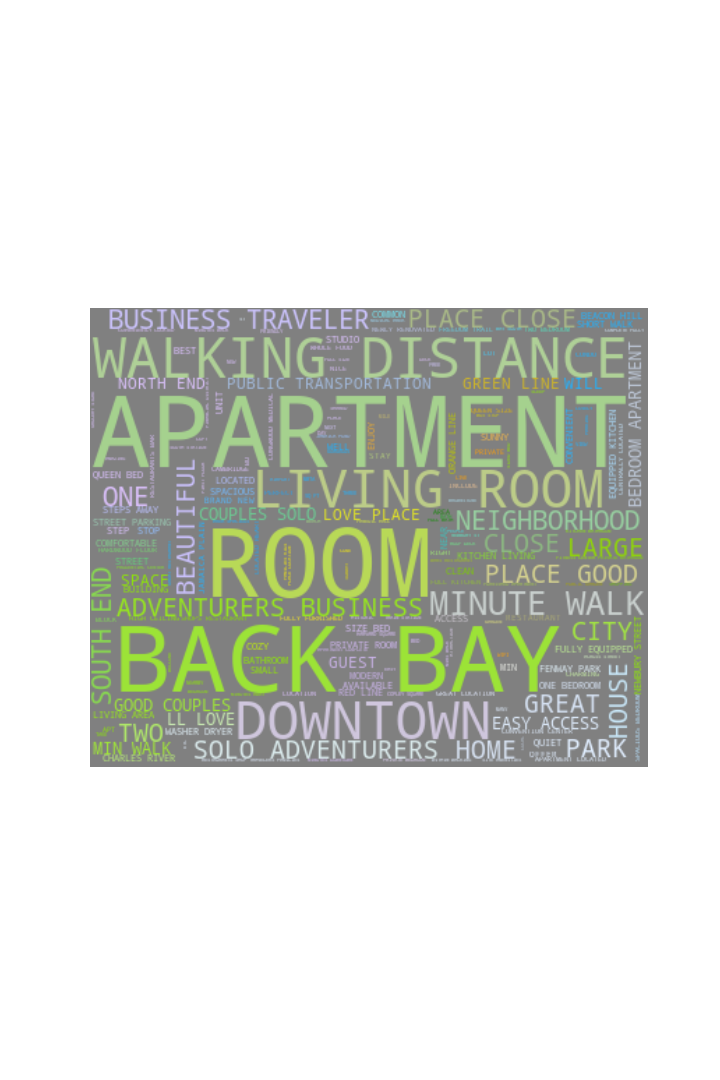
- What Do I Write In My Summary?
September turned out to be the most popular month for Boston as shown in the plot below.
Surprisingly, a rental will be empty about half of the time. However around the time of September listings simply vanish.
Finally we looked into the descriptions written by the landlords. South End and Back Bay are popular neighborhoods and mentioning those yield higher asking prices. The word cloud below shows the most popular words in listings:
In conclusion what we realized that words written in the summary had little effect on asking price. What mattered more by far was the number of guests we can accomodate and number of bathrooms.
I would like to acknowledge Airbnb for making this data free for the public. A huge thanks to Datacamp.com writer Duong Vu for this superb article on word clouds.


