This dataset has been built from six healthy subjects. Each subject has normal mental state, normal color vision, and age ranging between 25 to 35 years old.
The dataset has been made for two main categories which are: colors and shapes. (Red, Green, Blue, Yellow, and White) colors were used in the color mode.
According to the RGB standard, the red color was constructed by setting the red value to 255, while both green and blue values were set to zero (255, 0, 0). The green color is constructed by setting the green value to 255, with both red and blue value being zero (0, 255, 0). The blue color is constructed by setting the blue value to 255, with both red and green value being zero (0, 0, 255). The yellow color is constructed by setting red and green values to 255, with setting blue value being zero (255, 255, 0). The last one is white, constructed by setting all values to 255.
Forward, right, left and backward arrows with stop circle sign have been selected for the shape category. All sessions of brainwave signals have been recorded under two modes, which were: visible and invisible. In the visible mode, subjects focused on the colors and shapes presented to them. However, in the invisible mode, subjects thought about specific colors or the shape with closed eyes. the recording has been administrated for each participant in a dark room. Each subject has been seated on a comfortable chair faced with a 43 inch screen.
The screen was set to standard color mode with normal brightness and contrast. The distance between the subjects and the screen was 125 centimeters. Adequate information had been provided for each subject before recording any session, i.e. how many sessions would occur during recording brain signals, and how many times the color and the shapes would be presented.
After installing and configuring the EEG device on the subject’s head, the signal quality has been checked several times. Then, the participant has asked to look at the screen, do some brain exercises, and try to increase the attention level. In this study, the subject’s concentration is compulsory to achieve the quality brainwave signals.
The dataset structure has been organized as follows, the dataset has two main categories which are:
- colors
- shapes.
Each category has been recorded under two modes which were: visible and invisible. Each mode have five separate sessions for each individual category. Each session have two subsessions i.e. red, green for colors and forward, right for arrows, each subsession is recorded for 25 seconds.
In this paper [Classification of Brainwave Signals Based on Hybrid Deep Learning and an Evolutionary Algorithm] (https://doi.org/10.17656/jzs.10755) only two of colors and shapes from the dataset have been used see (Figure 1. presents the architecture of the dataset).
Two separate CSV files have been created for each sub-sessions and individual subjects. The first file stores the raw EEG signals with its time, while the second file contains recording time, brainwave band (α, β, γ, δ, and θ) values, attention level, meditation level, blinking strength, and signal quality level.
The structure of the dataset:
1. RawEEG : this directory contains the rawEEG records for each participants individually (six subjects).
- Directories [P1 - P6] contains 20 folders. Each directory contains record of a single session with respect to colors and shapes.
- P letter is used for individual participant identifier .
- S letter is used for session number.
- I letter is used as an indication for INVISIBLE sessions.
- V letter is used as an indication for VISIBLE sessions.
- A letter is used as an indication for ARROW categories.
- i.e: this folder P1_S1_A_I means (First Participant - Session #1 - Arrow Category - Invisible Mode)
- i.e: this folder P1_S1_A_I means P2_S3_V (Second Participant - Session #3 - Color Category - Visible Mode).
2. Prepared Data: Look at the Data Preparation section (3.5 Page# 54) at M.Sc. Thesis [Classification of Brainwave Signals Based on Deep Learning for controlling Electronic Devices] (https://github.com/Zhyiar/Univsul-Dataset/blob/master/M.Sc%20Thesis/Classification%20Brainwave%20Signals%20based%20on%20Deep%20Learning%20for%20Controlling%20Electronic%20Devices.pdf)
3. Paper: [Classification of Brainwave Signals Based on Hybrid Deep Learning and an Evolutionary Algorithm] (https://doi.org/10.17656/jzs.10755).
4. M.Sc. Thesis: [Classification of Brainwave Signals Based on Deep Learning for controlling Electronic Devices] (https://github.com/Zhyiar/Univsul-Dataset/blob/master/M.Sc%20Thesis/Classification%20Brainwave%20Signals%20based%20on%20Deep%20Learning%20for%20Controlling%20Electronic%20Devices.pdf).
Figure (2) presents flowchart of the dataprepartion used as a first proposed method in the mentioned paper and the M.Sc. thesis.
Figure (3) presents CNN architecture.
Figure (4) presents the architecture of the proposed model (in the paper), all modifications in the model are enclosed with blued dashed border.
Figure (5) The architecture of the second proposed model has been presented in (Figure 5).
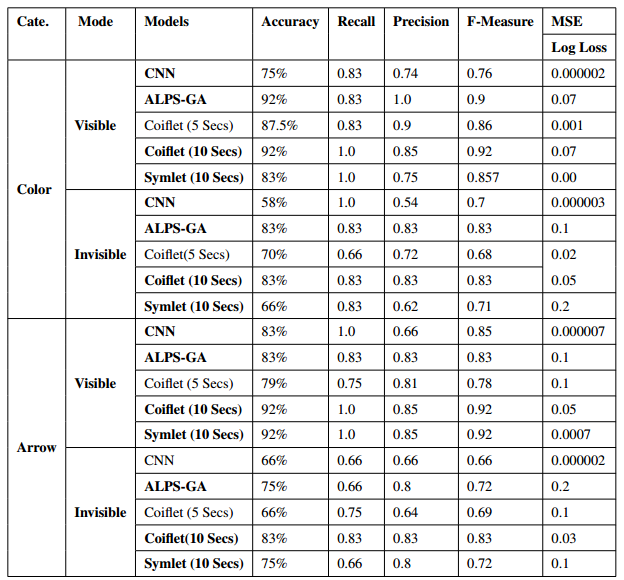
Figure (6) shows a comparison table between the CNN, hybrid CNN and ALPS-GA, combined CNN and Coiflet 1 with SGD, and combined CNN and Symlet 2 with SGD.
5. Colors and Shapes: contains colors and shapes used for recording this dataset.


