An open-source framework for the quantification of Urban Heat Islands based on Swiss open-data
In this project, open-source dataset are leveraged to build a framework for visualizing urban heat isaland (UHI) effect and demonstrate the application of scenarios on 1 case-study representative of the Swiss urban area.
Choose the geographical zone (tile, canton) for the area of study. Step 1 : Download the files, Step 2 : Import them to QGIS
Swissbuildings3D :
- Geodatabase format from https://www.swisstopo.admin.ch/en/geodata/landscape/buildings3d3.html#download
- Import Floor/Roof/Wall/streets/green layers
MO cadaster
- GeoPackage format from https://geodienste.ch/services/av
- Import lcsf layer, filter by "Genre"="batiment"
Ground Surface
- XYZ file format from https://www.swisstopo.admin.ch/en/geodata/height/alti3d.html
- Choose resolution of 2 meter or o.5 meter and load it with pandas.read_table
Ground Types
- Geopackage format from https://www.swisstopo.admin.ch/de/landschaftsmodell-swisstlm3d
- Import tlm_bb_bodenbedeckung layer, filter by 'objektart' IN ('Wald', 'Gehoelzflaeche', 'Gebueschwald', 'Wald offen')
- Import tlm_strassen_strasse layer, filter by "objektart" NOT IN ('Verbindung','Platz')
Scenario1
- Create a new layer with polygon objects representing newly added green grounds in QGIS
- Import Scenario1 layer
Create a new GeoPackage file. Add layers with the "export features" option of QGIS (export without "fid" field), with names :
- zone_cad : MO features of buildings connected to DHN
- zone_tout : MO features of all buildings in the area of study
- centrale : point feature of thermal heating station coordinates
- floor : swissbuildings3D features of floors of all buildings in the area of study
- wall : swissbuildings3D features of walls of all buildings in the area of study
- roof : swissbuildings3D features of roofs of all buildings in the area of study
- streets: swisstlm 3D features of streets in the area of study
- green: features of green areas in the area of study
- scenario1: new features of scenario 1 in the area of study
In addition to the newly created GeoPackage, a climatic and a horizon file must be provided and imported on the same directory as where the software code was cloned.
Before launching the "main_code.py" from command line, it must be custom modified for each simulation, either from a text files reading app or a python editor app such as Spyder or Visual Code Studio. Each modification is signaled with #TODO.
- gpkg_filepath = r"---.gpkg" : File path of the GeoPackage containing all necessary layers
- create_geometry_3D = True/False (default = False) : Activates the simulation with thermal envelope from Swissbuildings3D geometries (much longer simulation)
- calculate_volume_3D = True/False (default = False) : Activates the volume calculation from Swissbuildings3D geometries
- citysim_filepath = r"---/CitySim.exe" : File path of the CitySim solver
- directory_path = r"---" : Name of the new directory to be created by the simulation
- climate_file = r"---.cli" : File path of the climate file
- horizon_file = r"---.hor" : File path of the horizon file
The required libraries to import are listed in the requirements.txt file
The resulted .xml file is under the directory path defined in "main_code" And resulted temperature layers could be found with prefix "All_AST" in the .gpkg file used
Olivier Chavanne established a framework to process and analyze information of all buildings in the area of study and simulate the surface temperature of those buildings through Citysim. To measuring the effect of UHI, the effect of different kinds of grounds, e.g. asphalt road, concrete road, green areas, around buildings need to be added on existent framework.
XYZ contains coordinates information of a square lattice. To put it in to use of heat computing, triangulization is done on it, i.e. dividing everyone small squares of the lattices into two triangles along the diagonal line.
Permeable pavement represents. Asphald ground represents roads covered by asphalt Concrete ground represents roads covered by concrete Green grounds represents grounds that's green like grass, bushes and trees in total Sources
Here I list the attributons of different types of grounds that matters for Kfactor represents the humidity in the soil. Shortwaverefletance represents the ability to reflect solar energy and if the grounds is darker, it is smaller.
| Ground type | Kfactor | Shortwaverefletance |
|---|---|---|
| Asphalt | 0.1 | 0.14 |
| Concrete | 0.1 | 0.35 |
| Green | 0.7 | 0.22 |
| Pavement | 0.5 | 0.14 |
Functions below are significant and are added to xml.py
def add_ground_from_XYZ(ground_type, kFactor, Shortwaverefletance):
- Triangulize ground
- Discard grounds under buildings
- Create a geodataframe that contains all traiangles objects and assign all grounds the type of concrete road
def modify_type():
- Find grounds of road and green area through intersection with streets and green area objects
- Modify the type of concrete ground to type of asphalt ground or green area and attach physical characteristics like Kfactor and short wave reflectance acoordingly
def cut:
Discard grounds and buildings that's distant from my area of study to save computing time
def AST:
- Calculate average surface temperature of each building and atribute them to corresponding building according to surface_id
- Attribute temperature of each ground triangle according to gid
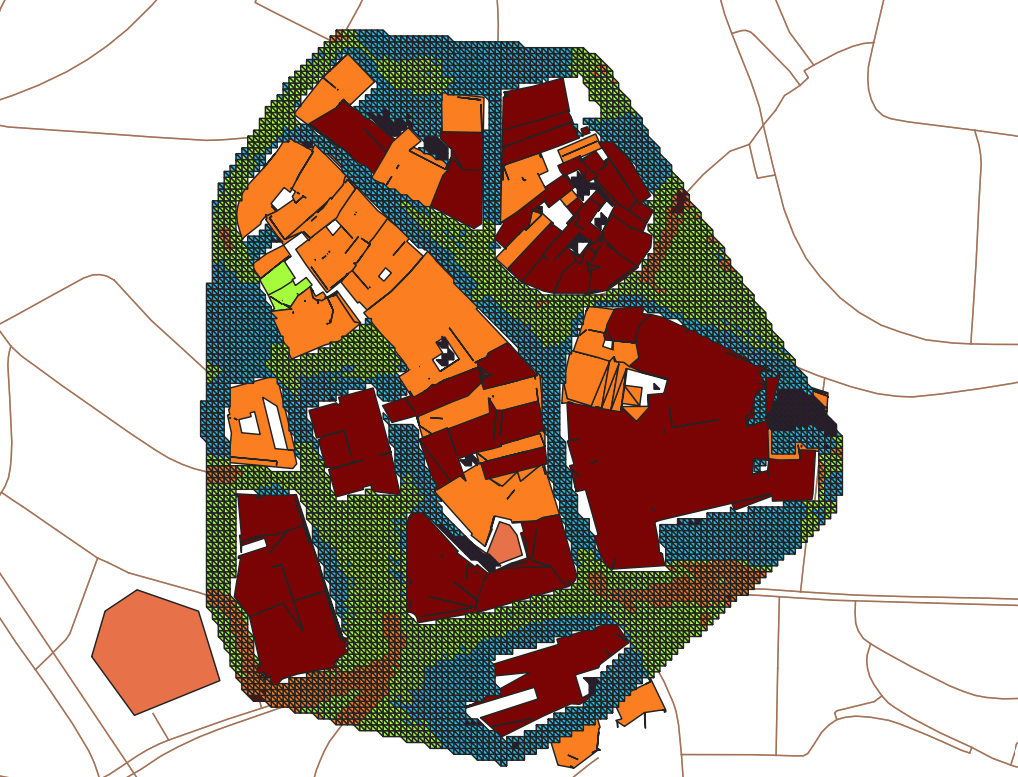
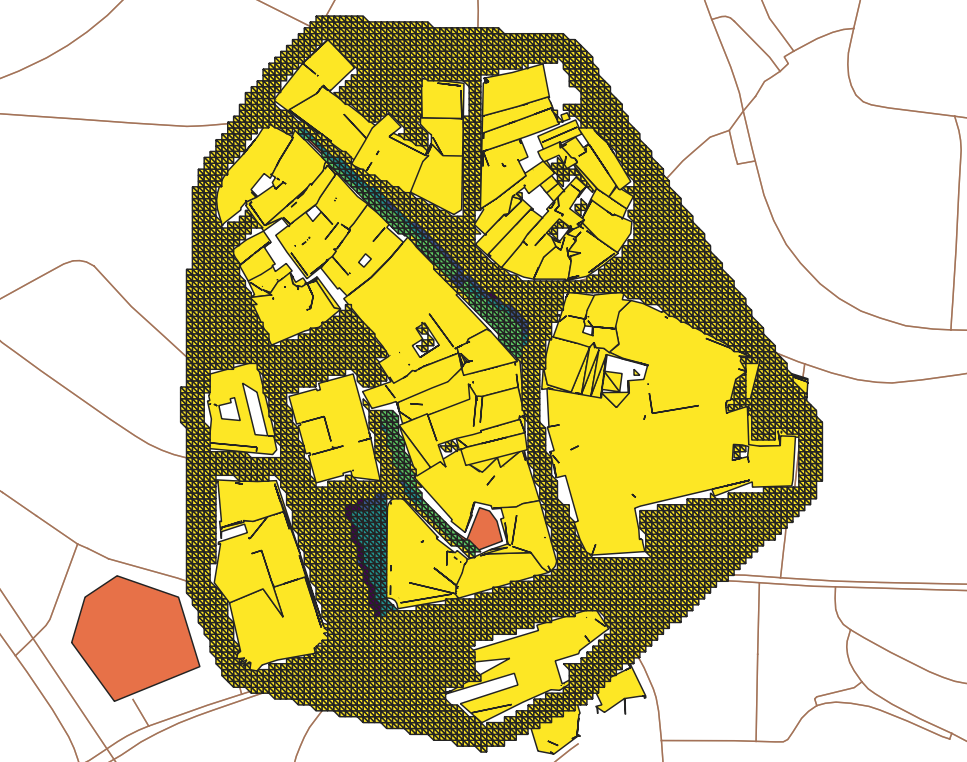
The case is a neighbourhood around fountaine de la Justice, Lausanne with dense buildings and roads network. While pavements is concrete road, streets are asphalt roads. And there is no green grounds in this area. So I add green grounds to see if it mitigate the UHI effect.
The 3D model is simulated in CitySim pro.

Run case-study with XYZ file of resolution being 2 meter, meteorological data for contemporary, 2030, 2040 and 2050, and visualise reseulted temperature data in QGIS. All relevant images can be found under folder image.
In QGIS, the blue zone represent the area of my study, the pink zone represents surround buildings, and the green zone represents the green grounds added in scenario 1.
A sample is shown below with blue reresenting low temperature, red representing high temperature:
- The defalut case study at 2050
In this project, open source datasets are obtained for different types of grounds. And based on them, mesh of grounds are created, and different ground surfaces are attributed right type and respective physical characteristics. The resulted .xml file is run and the case iis visualised in CitySim Pro.
One scenario, i.e. substituting original grounds of certain areas with green grounds, is demonstrated and its effects on urban heat islands is visualised in QGIS. It's evident that the closer to green areas, the greater is decreased tempeareture. With green area, the decrease temperature is greater than 0.66°C, which is perceptible in general.
- Develop an algorithm that can create adaptive mesh of grounds, i.e. finer mesh at sharp part of geometry objects.
- Add trees into our framework and study their effects on UHI
- Add water into our framework and study their effects on UHI
- https://github.com/ochavanne/CAD-O
- Upadhyay, G ; Kämpf, J; Scartezzini, J: Ground temperature modeling: The case study of Rue des Maraîchers in Geneva, 2014, URL: https://infoscience.epfl.ch/record/198754?ln=fr
- https://github.com/kaemco/CitySim-Solver/wiki/The-district#groundsurface
- https://www.eoas.ubc.ca/courses/eosc350/content/foundations/properties/density.htm#:~:text=Remarks,2.6%20and%202.7g%2Fcc.
- https://www.bruk.info.pl/en/guide/stone-size-thickness-and-chamfer-should-technical-parameters-matter-to-us/
- https://www.sciencedirect.com/science/article/pii/S2214509518300482#sec0010


