Simple Regression in Python. For detail implementation see regression.py file.
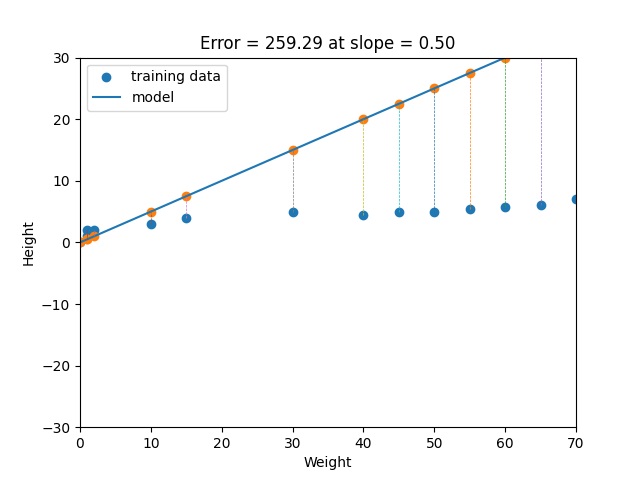
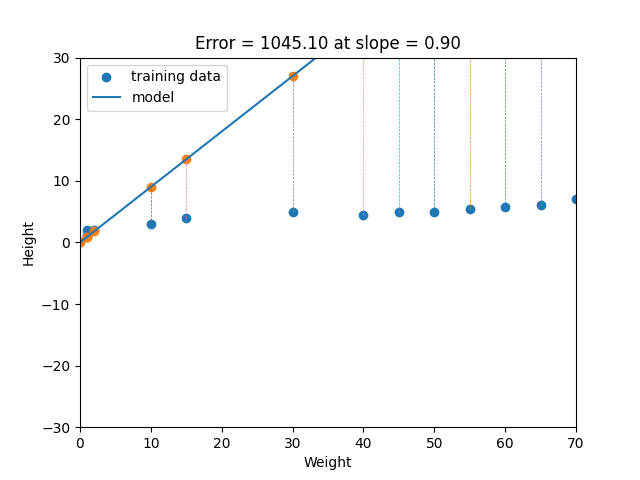
Linear regression is a statistical method that tries to show a relationship between variables. It looks at different data points and plots a trend line. Linear regression attempts to model the relationship between two variables by fitting a linear equation to observed data. One variable is considered to be an explanatory variable, and the other is considered to be a dependent variable. For example, a modeler might want to relate the weights of individuals to their heights using a linear regression model. Simply stated, the goal of linear regression is to fit a line to a set of points. When the target variable that we’re trying to predict is continuous, we call the learning problem a regression problem. Let’s suppose we want to model the above set of points with a line. To do this we’ll use the standard y = mx + b line equation where m is the line’s slope and b is the line’s y-intercept. To find the best line for our data, we need to find the best set of slope m and y-intercept b values.


