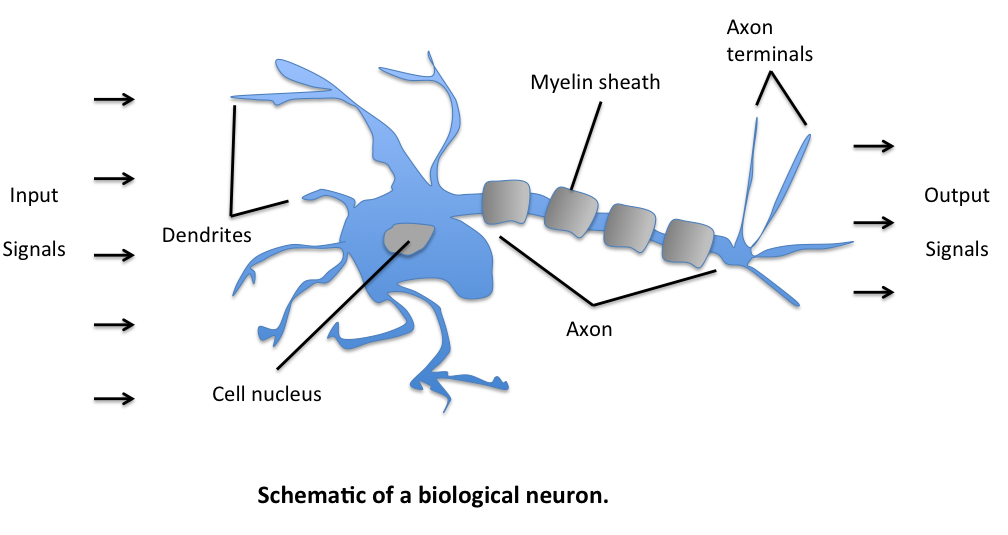
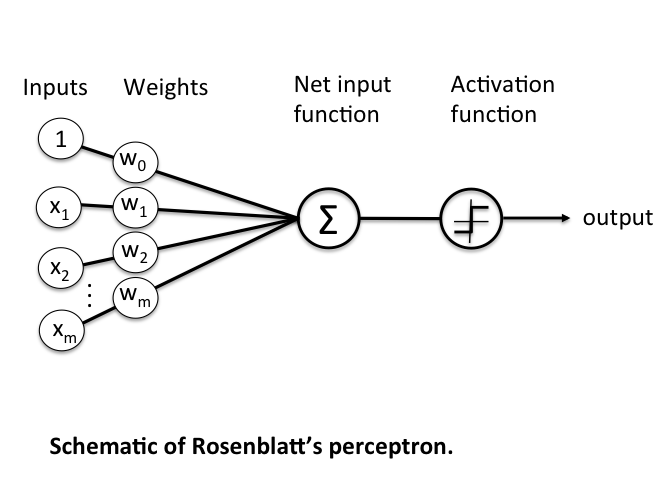
Invented in 1957 by Frank Rosenblatt at the Cornell Aeronautical Laboratory, a perceptron is the simplest neural network possible: a computational model of a single neuron. A perceptron consists of one or more inputs, a processor, and a single output.
- For every input, multiply that input by its weight.
- Sum all of the weighted inputs.
- Compute the output of the perceptron based on that sum passed through an activation function (the sign of the sum).
import numpy as np
import matplotlib.pyplot as plt
import seaborn as sns
import pandas as pd


def step_function(x):
    if x<0:
        return 0
    else:
        return 1


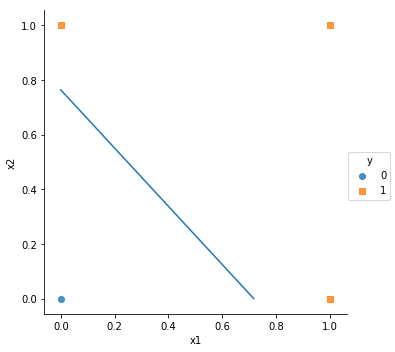
training_set = [((0, 0), 0), ((0, 1), 1), ((1, 0), 1), ((1, 1), 1)]

# ploting data points using seaborn (Seaborn requires dataframe)
plt.figure(0)

x1 = [training_set[i][0][0] for i in range(4)]
x2 = [training_set[i][0][1] for i in range(4)]
y = [training_set[i][1] for i in range(4)]

df = pd.DataFrame(
    {'x1': x1,
     'x2': x2,
     'y': y
    })

sns.lmplot("x1", "x2", data=df, hue='y', fit_reg=False, markers=["o", "s"])


# parameter initialization
w = np.random.rand(2)
errors = []
eta = .5
epoch = 30
b = 0


# Learning
for i in range(epoch):
    for x, y in training_set:
      # u = np.dot(x , w) +b
        u = sum(x*w) + b

        error = y - step_function(u)

        errors.append(error)
        for index, value in enumerate(x):
            #print(w[index])
            w[index] += eta * error * value
            b += eta*error

        ''' produce all decision boundaries
            a = [0,-b/w[1]]
            c = [-b/w[0],0]
            plt.figure(1)
            plt.plot(a,c)
        '''


# final decision boundary
a = [0,-b/w[1]]
c = [-b/w[0],0]
plt.plot(a,c)

# ploting errors
plt.figure(2)
plt.ylim([-1,1])
plt.plot(errors)


