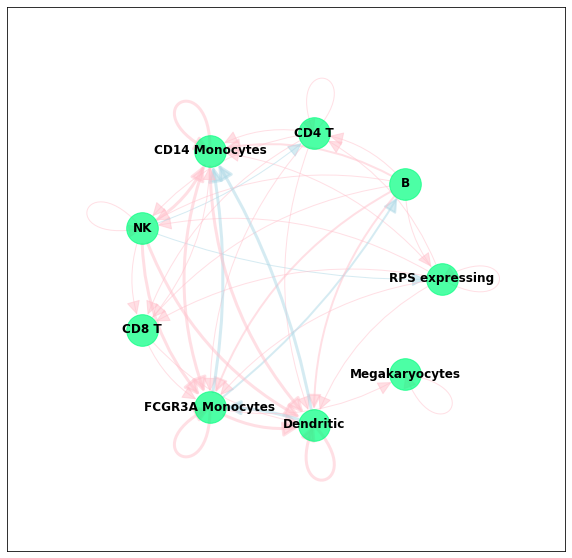
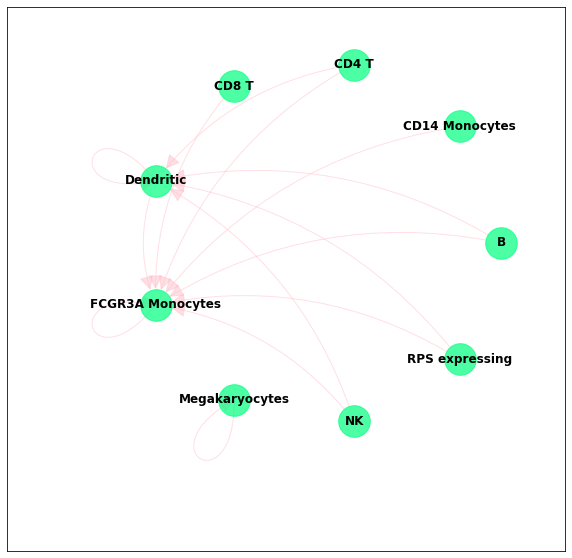
A simple interface for the tools that predict cells communication from Single-Cell RNA sequencing data
- Clone the repository
$ git clone https://github.com/VladimirShitov/communiquer.git- Install poetry. Recommended way:
$ curl -sSL https://raw.githubusercontent.com/python-poetry/poetry/master/get-poetry.py | python -Alternative way (not recommended):
$ pip install --user poetry- Install project's python dependencies:
$ poetry install- Install tools for inferring cells communications. Follow the instructions from the repositories:
- Cellchat
- CellPhoneDB
- CellCall (not yet supported)
Make sure that cellphonedb is added to the PATH (i. e. you can run it via command line from any directory)
- Run the code!
Import packages:
from pathlib import Path

from communiquer.launchers import CellChatLauncher, CellPhoneDBLauncher
from communiquer.drawing import draw_chord_diagram
Provide paths to the data. You have to prepare 2 files:
- Normalized counts matrix. Rows are genes, columns are barcodes (or other cells IDs
- Meta information about cells. It must have 2 columns: the first one with cell IDs (e.g. barcodes), and the second with cells labels (e.g. cell types)
counts_path = Path("data/pbmc3k_counts.tsv")
meta_path = Path("data/pbmc3k_meta.txt")

cpdb_output_path = Path("data/cpdb_output")
Example of the meta file:
| Cell | cell_type |
|---|---|
| AAACATACAACCAC-1 | RPS expressing |
| AAACATTGAGCTAC-1 | B |
| AAACATTGATCAGC-1 | CD4 T |
| AAACCGTGCTTCCG-1 | CD14 Monocytes |
| AAACCGTGTATGCG-1 | NK |
| ... |
cpdb_launcher = CellPhoneDBLauncher(
    meta_file_path=meta_path,
    counts_file_path=counts_path,
    output_path=cpdb_output_path,  # CellPhoneDB saves its output to the files
    project_name="pbmc3k",
    counts_data="gene_name"  # If you have Ensemble IDs, leave default
)
cpdb_launcher.run()
cpdb_launcher.read_output(convert_to_cellchat_format=True)
Then you can display the output by checking:
cpdb_launcher.pvalues_df
cpdb_launcher.means_df
To see outputs of this code, check example notebook
Count significant interactions and build a chord diagram with them:
cpdb_launcher.count_significant_interactions() # This sets cpdb_launcher.counts_df
cpdb_launcher.visualise_interactions()
Or a dot plot:
cellchat_launcher = CellChatLauncher(counts_file_path=counts_path, meta_file_path=meta_path)
cellchat_launcher.run()
cellchat_launcher.read_output()
You can then view the output:
cellchat_launcher.weights_df
cellchat_launcher.pvalues_dfs
cellchat_launcher.probabilities_dfs
Cellchat stores every interaction in a different matrix. You can access these interactions by name:
cellchat_launcher.pvalues_dfs["ESAM_ESAM"]Check the outputs in the example notebook
You can run visualisations with the same interface:
cellchat_launcher.visualise_interactions()cellchat_launcher.dotplot_counts()


