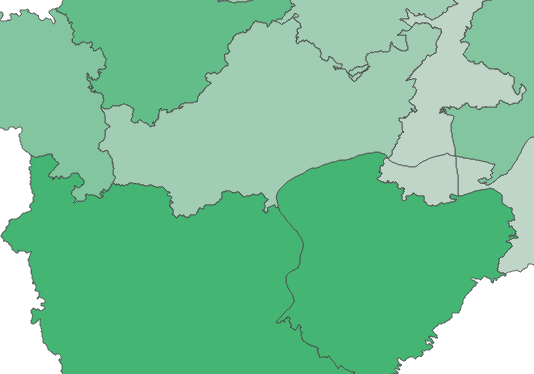
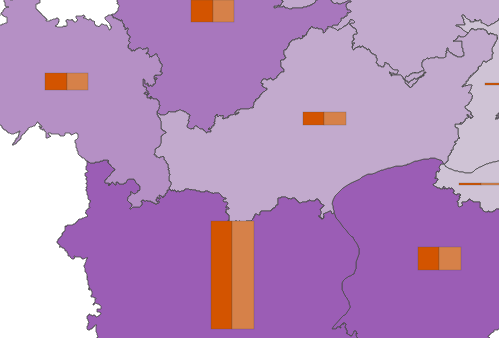
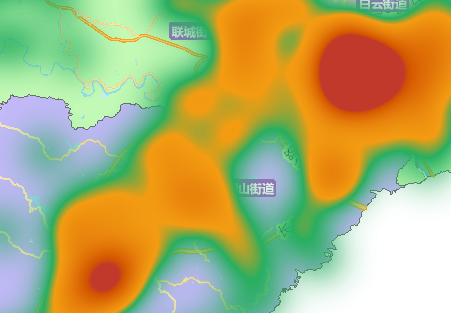
基于ArcGIS API for Javascript封装的专题图制图类库,要求版本3.13+
-
使用方法简单:
简单几步完成专题图绘制,使用方法
-
制图种类丰富:
当前支持
柱状图专题图饼状图专题图范围值专题图热力专题图以及柱状+范围值组合图饼状+范围值组合图,并不断丰富中 -
支持独立统计数据:
统计数据不依赖地图服务,支持基于
独立统计数据的专题图开发 -
支持链式调用:
histogramMap.setConfig(options).setStatData(data).draw(callback);
-
文件下载
将OTMap文件夹放置在自己的项目中,dist和src分别为
部署版和开发版dist //压缩后代码,部署请使用该文件夹下OTMap src //源代码,开发者请使用该文件夹下OTMap screenshots //效果截图 samples //使用样例代码
-
路径配置
在index.html中添加OTMap路径,注意dojoConfig的配置要在arcgisJsApi引用之前
  var package_path = window.location.pathname.substring(0,window.location.pathname.lastIndexOf(''));
    var dojoConfig = {
      packages:[{
        name:'OTMap',
        location:package_path + '/OTMap'  //OTMap所处的相对路径,当前为index.html同级目录
      }]
  };
——以柱状图专题图为例
-
引用及构建对象:
define(["OTMap/index"],function (OTMap) {
  var histogramMap = new OTMap('histogram');

});
-
制图参数设置:
histogramMap.setConfig({
  map: myMap,
  layer: {}
  ... ...
});
-
专题图绘制:
histogramMap.draw();
如何有任何疑问或更好的建议,请通过 New Issue 来向我反馈。
OTMaps is available under the terms of the MIT License.


