

This application is not a replacement for the Zurich instruments Labone software, it is meant to be used along side it. You still have to use Labone and connect your instrument to it.
The goal of this application is to be able to bypass the limitation of using the 4 auxiliary signals of the HF2LI by taking the signals data directly from the HF2LI through the USB port instead of coaxial cables. The application will communicate with the HF2LI API using Python to obtain all the demodulators data streams (R, Theta, X, Y, Frequency) we need and plot as many graphs as we want. It has more specifically been built for DFRT PFM, you can also see Guide of David ALBERTINI
update : Zi² and its creator have been cited in the Zurich Instruments Q4/2020 News Letter in the User Story section, there is also an interview of David ALBERTINI !
There are two ways of running this application, either using an simple EXE for Windows that has to be launched within its folder (because they contain all the python modules, application data etc...) and that requires no installer. Or by running the Source code of the application with Python and all the modules. In which case you'll need :
-
Numpy module version 1.19.0, to deal with matrixes and data
pip install numpy- Zhinst module version 20.1.1335 (from Zurich Instruments), to communicate with the HF2LI
pip install zhinst- Matplotlib module version 3.2.2 (upper versions don't work if you want to create an EXE), to do annimated 3D plotting
pip install matplotlib==3.2.2- Datetime module (usualy included in Python), to get the current time
pip install DateTime- Pillow module version 7.2.0, to load pngs to the GUI
pip install pillow- Gwyfile module version 0.2.0, to save microscope's images
pip install gwyfileThe versions of the modules shouldn't cause any problems except for matplolib which for some reason won't run in an EXE in versions upper than 3.2.2, I just included my versions in case you have problems and want to replicate my setup to avoid any conflict.
Like i said there no installer, just a folder wich contains all the necessary files. If you want the Windows EXE version than :
- download the Github binaries in the latest release as a ZIP
- UnZIP it and open it
- Find the executable named "Zi².exe"
- Run it, INSIDE ! the Zi folder or just make a shortcut to run it from anywhere
If you want to run the source code than :
- download the Github repository as a ZIP
- UnZIP it and open it
- Go to the folder named "Source code"
- find the file "Zi².py"
- Run it with your editor (Python's IDLE, Vscode, etc...)
Here you can see the "Command" part of the GUI which is divided in Tabs

-
Demods In which you can select the demod you want and the data you want to plot from it
-
Settings (line by line)
- Tell the software in which direction the microscope is scanning by clicking on "Up-Down" which changes to "Down-up" and vice versa so that the application starts plotting in the right direction. If you make a mistake you can just click on "Flip" to Flip the image.
- Draw represents the number of Images you want to make, if you have the Nanoscope V and HF2LI then put 0, it will run continuously like the Nanoscope V does and synchronize with it. If you put another number than 0 the process won't be synchronized but it will make the number of images you requested. TLDR : Let it at 0 unless you know what you're doing
- Size is simply the size in pixels of the square images you want to make (limits are 32 and 4096)
- Freq is the frequency of line scanning (number of lines per second) put the same as in the Nanoscope V software (capped at 4hz)
- Display mode let's you select wether you want to see the trace or retrace of the AFM image, however both are saved so it's just for visualization
- Color is just the color grading for the scale in the 3D graphs
-
Save
- Sample is the sample name, it will change the name of the files that will be saved, the files will be saved in a different folder that will be named "Year-Month-Day" and the files in it will be "Hour-Minute-Second ; SampleName ; HF2LI id ; demods X sample,Y ; frame Z trace.format" and another named the same with retrace at the end. X is the demod number Y the demod data Z the number of the frame being saved and format the format which can be csv or gwy TLDR name of sample
- Save image check if you want to save
- Save to custom dir check if you want to save in the directory you've chosen instead of the default address
- Custom Directory Path the path to your custom address, you can click in the "..." button to choose one instead of typing
-
Connexion & more (appears if you check advanced settings)
- Connect at launch, simply does the same thing as if you where to click the connect button but it does it automatically when you launch the application
- Hostame and port, let those at default value if you connect to the HF2LI via USB
- Manual sampling rate, allows you to overwrite the sampling rates set by the application in order to acquire the trigger signals correctly, read the Zi² manual for more information on that.
- Save to gwy and save to csv allows you to chose in which format you want to save your data, you can select both.
-
Controls
- Reset , resets all the images and waits for a Vertical Trigger from the Nanoscope V to plot
- Pause , pauses the graphs but does not pause the sampling process, so it's just a graphical pause but not a real pause
- Start, verifies that all the settings are correct, initializes the graphs and then waits for a Vertical Trigger from Nanoscope V to begin the sampling process and plotting
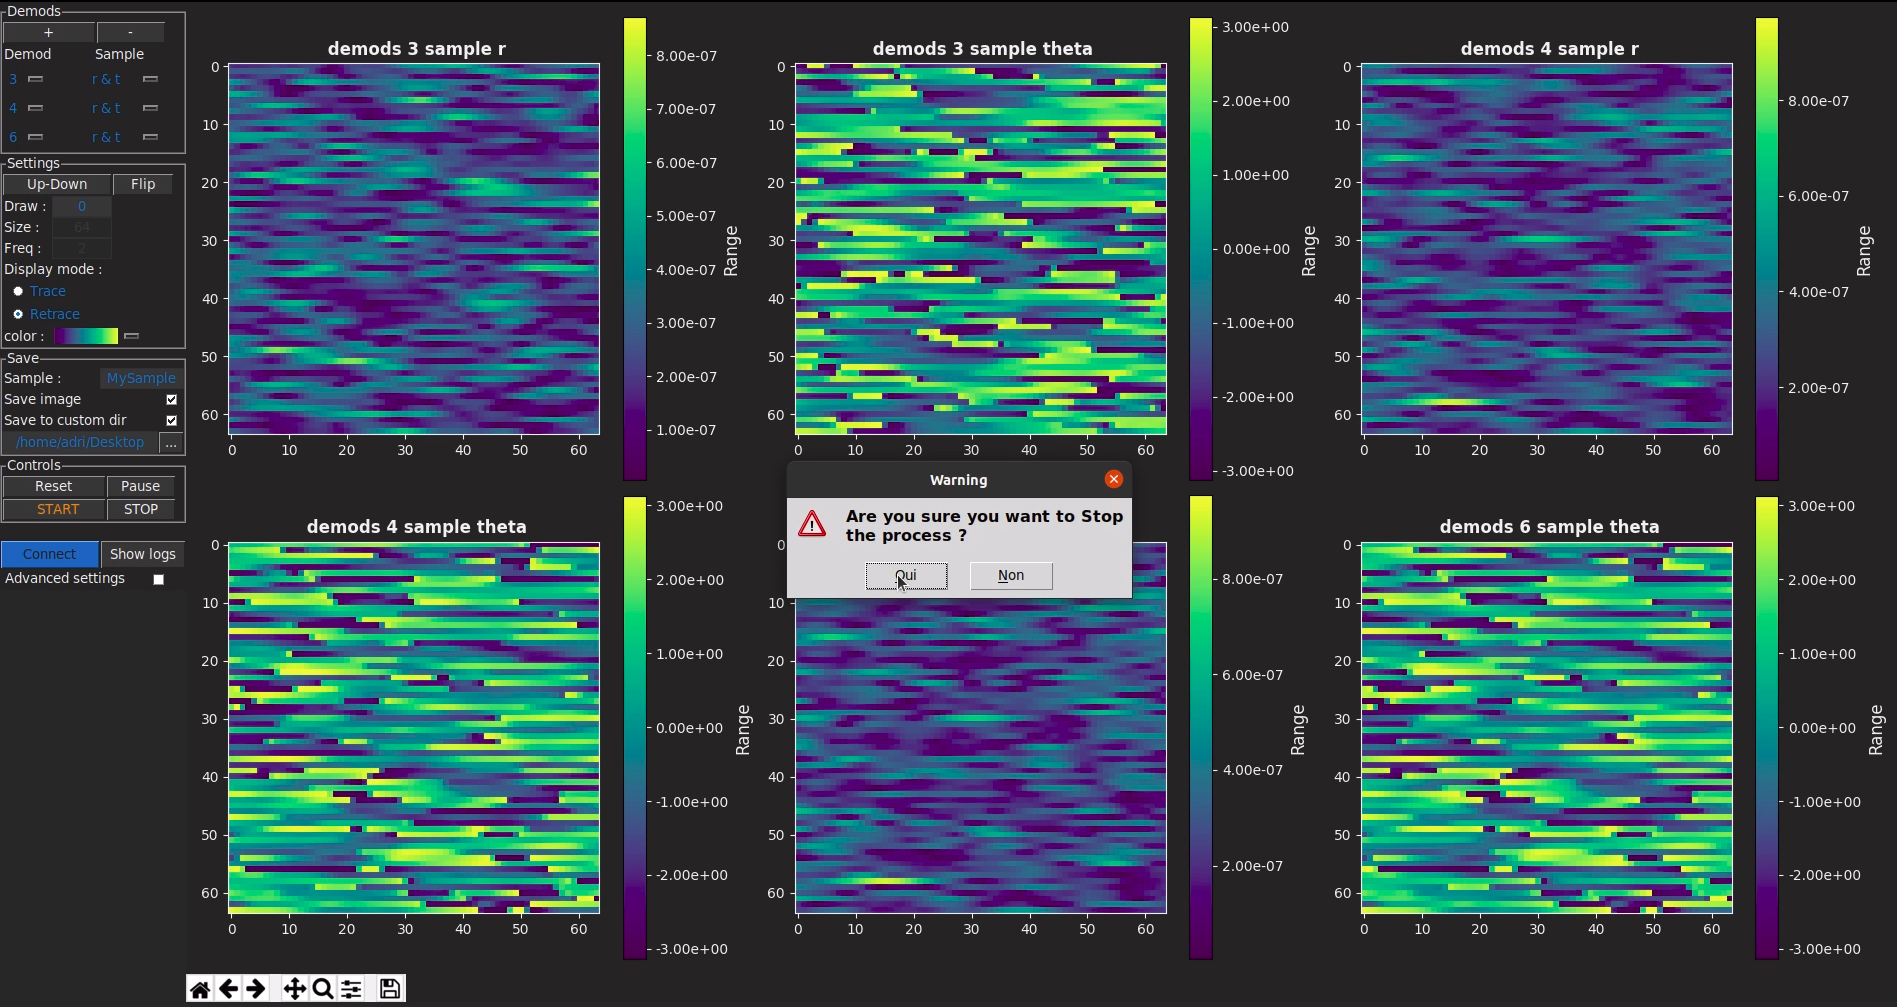
- Stop, stops all the processes and clears the graphs, confirmation box before stopping
-
Connect Connects to your HF2LI, make sure Labone is running
-
Show logs Opens a window with logs and tells you what the program does, also tells you if there are problems so feel free to use it if something goes wrong.
-
Advanced settings, make the "Connection & more" tab disappear if unchecked and vice versa.
The application is protected by the CeCILL-C FREE SOFTWARE LICENSE AGREEMENT
"The purpose of this Free Software license agreement is to grant users the right to modify and re-use the software governed by this license. The exercising of this right is conditional upon the obligation to make available to the community the modifications made to the source code of the software so as to contribute to its evolution."
You can also read the full LICENSE
You can contact me at [email protected], however I no longer work on this project since it was for a 2 months internship
I'd like to thank the INL and both of my internship tutors, David ALBERTINI [email protected] and Nicolas BABOUX and for the guidance they provided in this project, as well as Mehdi ALEM [email protected] from the Zurich instruments support team which did an amazing job of explaining how to properly use of the HF2LI programming features.
Please consider reading the manual to see common errors if something goes wrong, and if the problem can't be solved i re-command you read Zurich instrument's manual
if you have the necessary knowledge i also encourage you to modify the source code so as to solve the problem and share your results with the community.
version 1.1 as launched with some minor tweaks to the GUI, and and the plotting of the data, see release notes for more information.
This is what the new interface looks like :

now you will see the units of the data you are plotting

Plotting some noise

 Plotting data from a real sample

