You can find our dashboard here! Please view in full screen.
The Happiness Navigator app dashboard is an interactive visual tool to help users navigate, filter, and compare the results of the World Happiness Report. The report is a survey of citizens from each of the 153 participating countries that attempts to quantify their overall happiness and quality of life over a range of metrics, and then combines this information into a single happiness score.
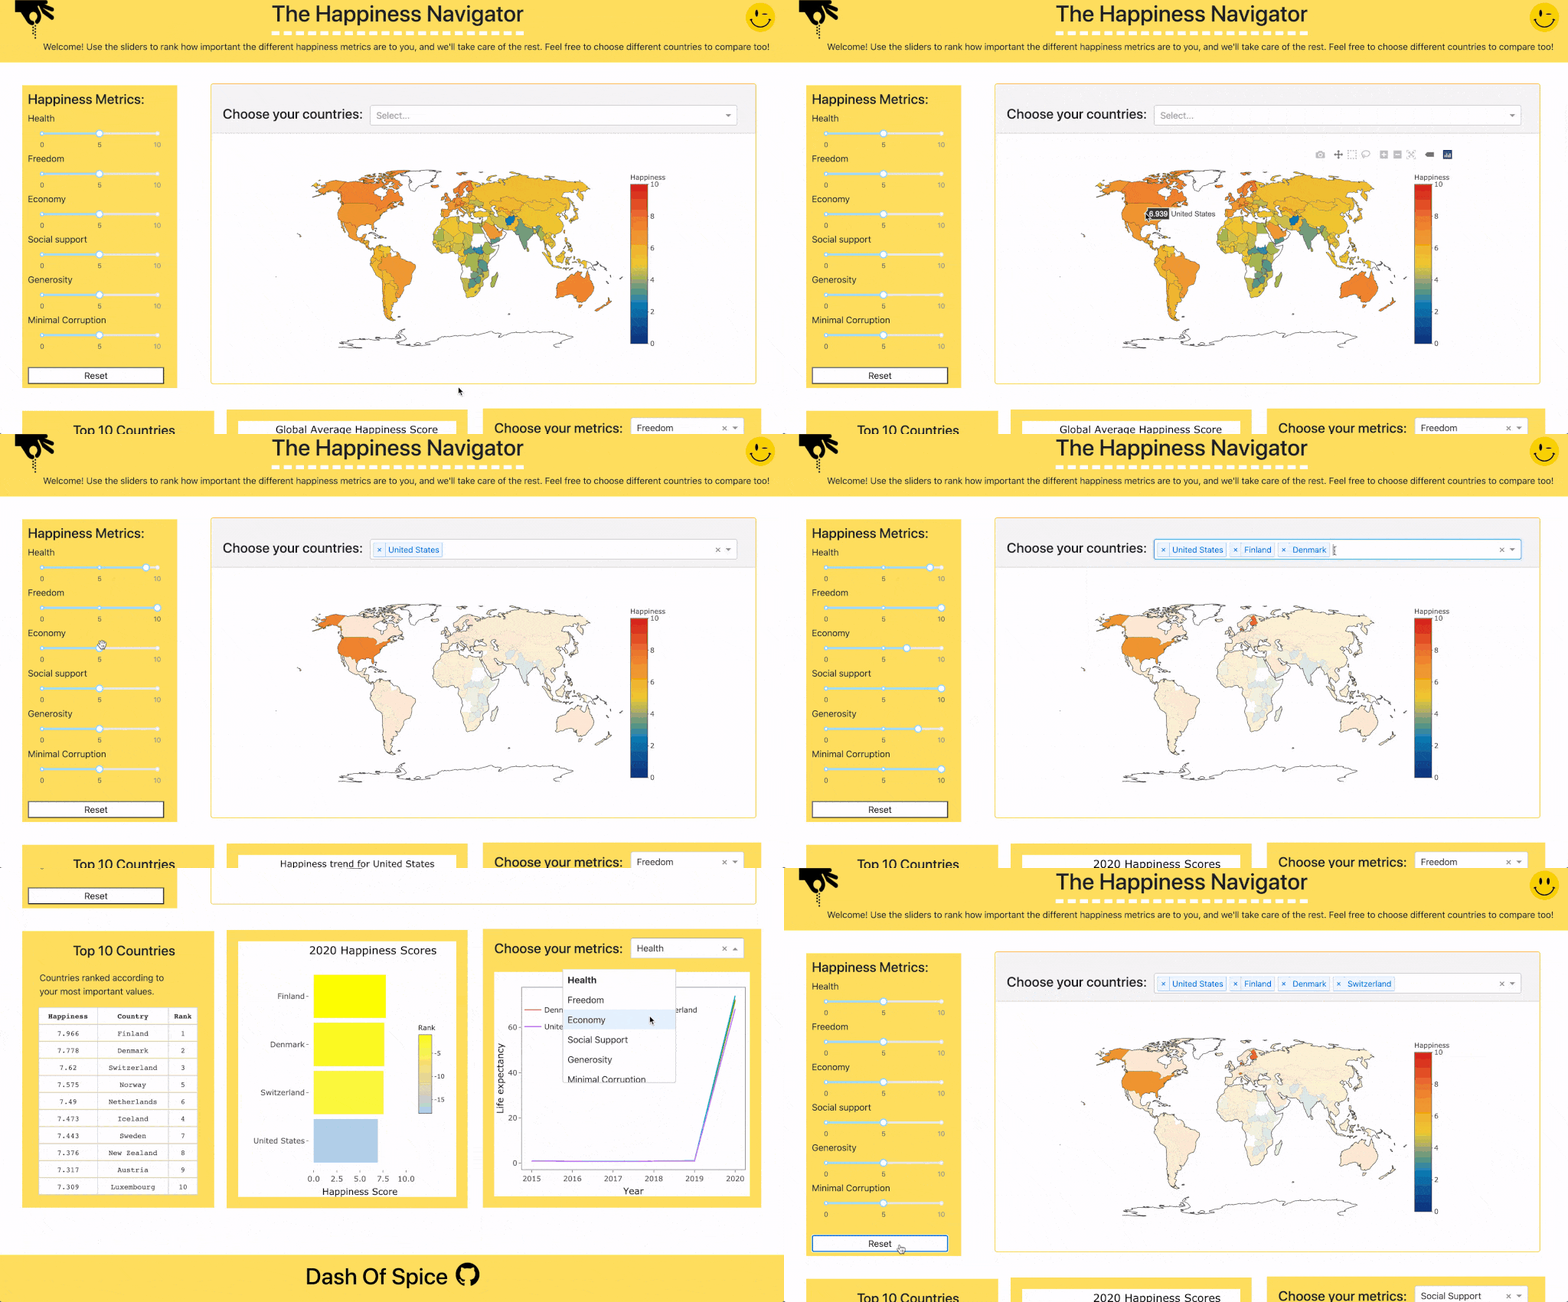
The main visual focus of the app is a navigable world map, where if no countries are selected uses a sequential color gradient and legend to indicate the happiness scores of each nation. The map is clickable and countries can also be searched for through the drop down search bar. Both options will result in the corresponding countries being highlighted on the map for a visual referece.
The happiness scores of a country are dependent on the slider values that a user picks. After setting different slider values, a user can find their top 10 personalized countries list in a table below the sliders. Next to the table are a bar plot and line plot that show different statistics for selected countries. If no country is selected, global average statistics are shown in the plots instead.
The final dashboard in all its glory! Try and find the hidden easter egg!
At Dash of Spice, we aim to provide an easy-to-use application to individuals and families looking to immigrate to a country that aligns best with their values. Our dashboard utilizes a user's key values to suggest countries that would provide maximum happiness if they immigrated there.
- Help facilitate decision making process for immigrants by comparing countries across the world
- Allow users to specify specific criteria (happiness, GDP per capita, freedom to make life choices, etc.) that are most important to them
- Display multiple visualizations to show statistics for different countries and global averages
- Compare and contrast different countries for the current year and five years into the past
With the stigma surrounding mental health slowly evaporating and more people openly discussing their mental struggles and seeking help, there is an increased need for accessible information regarding happiness. All over the world, people are looking for new adventures and new beginnings with a hope to find a place they can call home. These new beginnings often start with an immigration process that can be complicated and difficult, especially with the fast changing pace of society. Our purpose is to help facilitate the decision making process for those people wanting to immigrate to a new country.
To run the app locally and reproduce yourself, fork this repo and follow the below steps in your local repository root:
-
Create a new Python conda environment to run data wrangling scripts:
conda env create -f /env/happy_navvy.yaml -
Activate the conda environment:
conda activate happy_navvy -
(Optional) Execute the raw data pre-processing script
python src/preprocess_data.py -i data/raw -o data/processed/ -
(Optional) Execute the happiness computation weighting script
python src/compute_weights.py -i data/processed/tidy_happy.pkl -o data/processed/ -
Install R packages
Rscript init.R -
Run Dash
Rscript app.R -
Run Dash Run! Comment out
app$run_server(host = '0.0.0.0')in the app.R file (this is just for Heroku deployment) and switch it toapp$run_server(debug = F). Enter the local server URL into your browser: http:https://127.0.0.1:8050
At Dash of Spice, we are a team of data scientists working for a fictional immigration consulting company. The founders of Dash of Spice - Rachel, Saule, Chad, and Craig - are friends from the Master of Data Science program at The University of British Columbia. The development of Happy Navvy was made in part of the course DSCI 532 - Data Visualization II.
If you are interested in joining us, please check out our contribution file for more information!
