This is an upgrade version of my previous known Home Dashboard!
Honestly, using Grafana in my day to day life at work, at home and pretty much everywhere is kind of addicting.. However! I do find a great use for it and use all this data, it's just not for looks. I've got it running on a Vertical Monitor mounted above my 15u server rack.
My current setup consists of one Proxmox hypervisor where I run all my LXC Containers and VMs for all my used tools. Ontop of that I run Docker for some Docker specific tools, which I'll get into later on.
I hope I can inspire people to use Grafana in their own homelabs, work envs or wherever you'd like. It honestly is an amazing tool, which can be daunting at first, but once you get the hang of it is an absolute blast to work with!
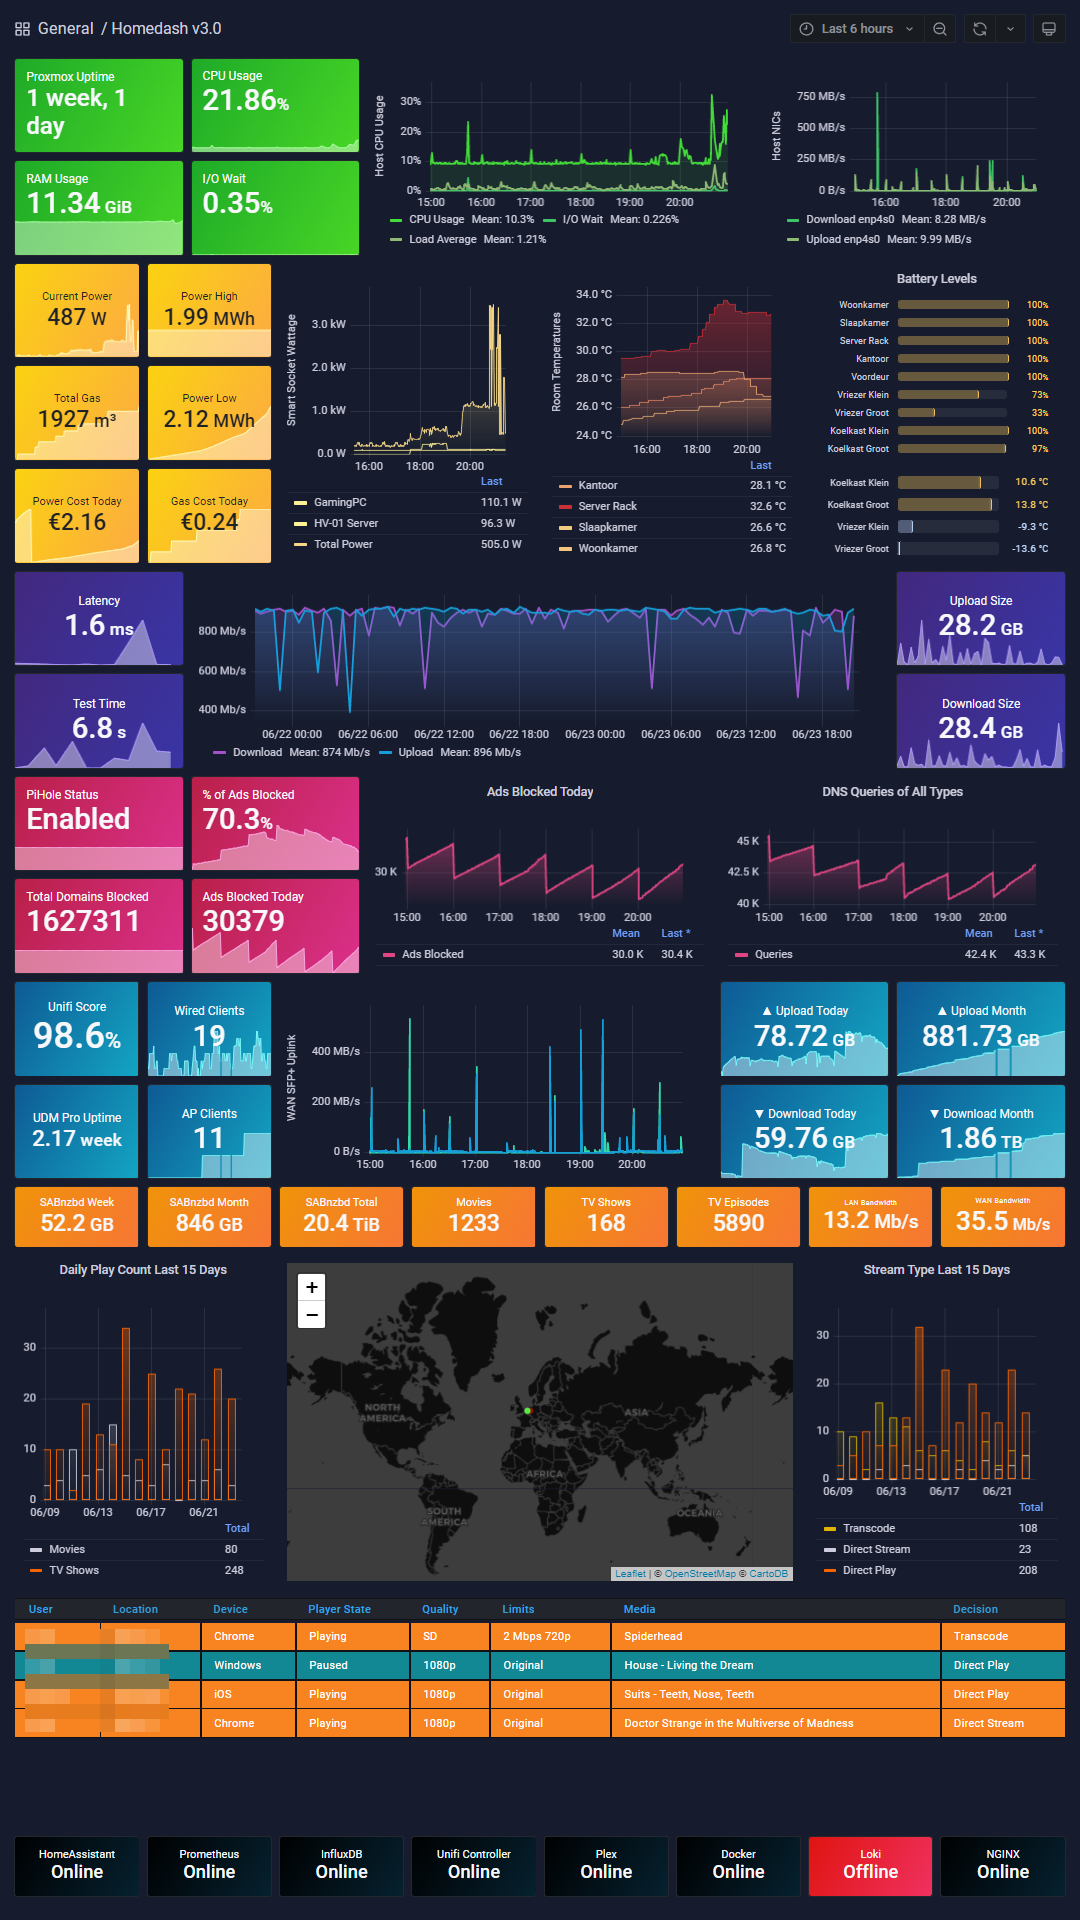
- Statistics from my Proxmox Server
- Electricity and Gas usage through a P1 Meter with HomeAssistant
- Temp sensors around the house + freezer/fridge
- Speedtest CLI
- Pi-Hole Exporter for my PiHole Stats
- Unifi / UDM Pro information + WAN Monitoring + Data Usage
- SABNzbd Downloads
- Plex Bandwidth Usage
- Plex Plays + location map
- Plex Current history
- Service Status
Proxmox itself actually has a pretty nifty built in Metric Server which can export to InfluxDB. Simply point it towards your Influx instance and it will start collecting data. Basic Proxmox Dashboard can be found here
The most important data like U ptime, CPU/RAM Usage, I/O Wait and network usage is all displayed here.
To collect this data I have a smart meter with a P1 Port. Using a HomeWizard P1 Monitor (Dutch only) I export this data to Home Assistant, which runs in a VM on my Proxmox machine. From here I basically visualize it's default metrics and have used some scripts to make custom entities for daily costs/usage.
I make use of Xiaomi Aqara series sensors to collect temperature, humidity and power levels from all over my house. All of this data is collected by Home Assistant using a Conbee II Stick. I've got alerts setup to alert me when the fridge or freezer temps become too high (in which case me or my partner have probably left it's door open.. ) Setting these up with Zigbee2Mqtt has been a real breeze, takes about 5 or so minutes to properly set it up. From there on out simply enable Prometheus or Influx in Home Assistant and export the data!
I monitor my internet bandwidth using a Speedtest CLI script I found which exports to Prometheus. I run this script about every 45 minutes, which collects download and upload speeds, latency and data used while running the Speedtest. I've had issues in the past where my ISP screwed up my speeds (I have 1Gbps Symmetric Fiber) which made them run at half my paid speeds. This helps me monitor my speeds (it does fluctuate a bit from time to time but that's mostly due to Speedtest servers sucking big poopoo)
If you're not running Pi-Hole already, I highly recommend using it. It's a network based adblocker that basically acts as a blackhole for blocked DNS requests. You can add your own domains to it, it works on mobile devices (where you wouldn't normally be able to install an Adblock app) and even allows for internal DNS records. 10/10 highly recommend.
As of about a month ago I upgraded from a self-hosted Unifi Controller to a Unifi Dream Machine Pro. From here I make use of Unifi Poller to export some basic data about my client connectivity, uptime and WAN throughput through my SFP+ connection. Through Unifi Poller I have also visualized the amount of data I upload/download per day and per month.
SABnzbd is what I use to download linux ISO's and keep an eye on my RAID 6 storage pool. I use a simple SABnzbd Exporter connected to Prometheus to view this data. Nothing really special to it.
Finding out about Plex has sparked my Homelab journey about 4 years ago and I haven't stopped loving it. It's great to watch media, share media with friends or family and saves me the hassle of switching between 10000 different streaming platforms (looking at you here Netflix, Amazon, HBO etc). I make use of an awesome lib called Varken to export all this data from Tautulli to InfluxDB. If you are running a Plex server yourself I'd highly recommend checking out both Tautulli and Varken as they are both incredibly powerful tools for Plex server statistics.
I monitor all my critical services with Node Exporter installed on every LXC container I use. By simply using the up metric from Node Exporter I can view the status of my services. Next to this I also run an Uptime Kuma status page and an external Hetrix Tools monitoring page to monitor all my critical and non critical services.
Any questions you might are more than welcome and I'll do my best to answer them all as best as I can. You can reach out to me through my Discord @ Tehlo#0001