SpatialDM (Spatial Direct Messaging, or Spatial co-expressed ligand and receptor Detected by Moran's bivariant extension), a statistical model and toolbox to identify the spatial co-expression (i.e., spatial association) between a pair of ligand and receptor.
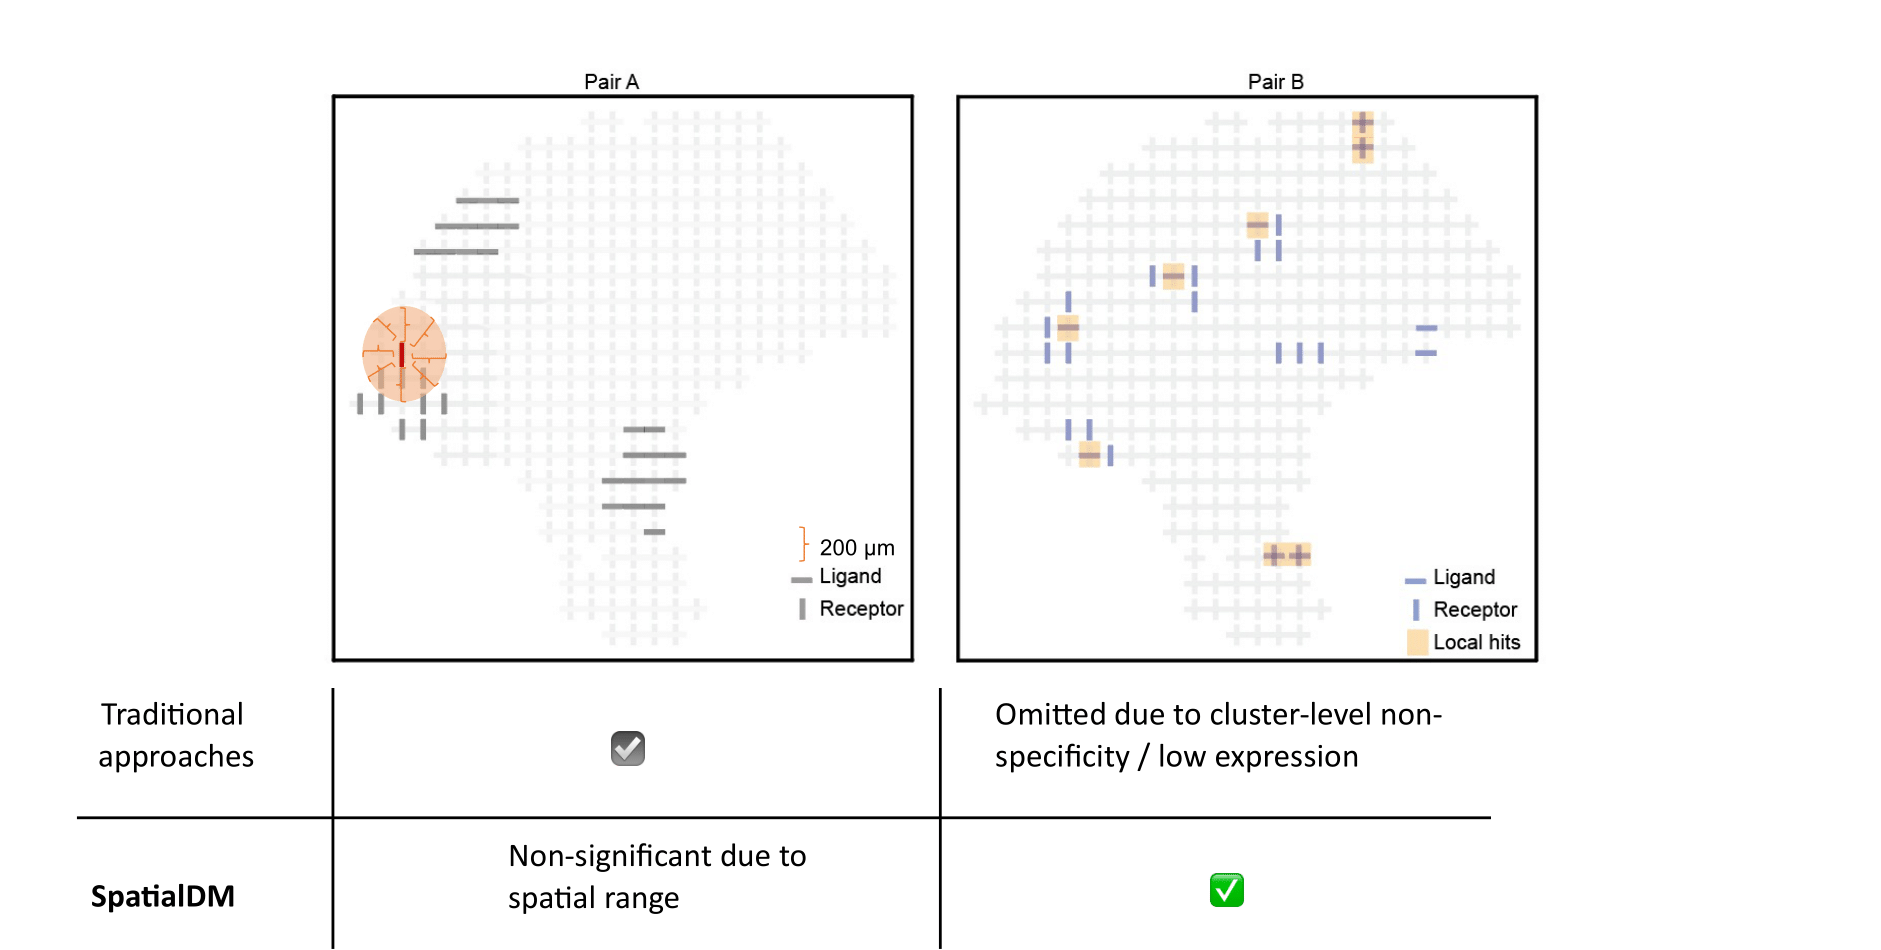
Uniquely, SpatialDM can distinguish co-expressed ligand and receptor pairs from spatially separating pairs, and identify the spots of interaction.
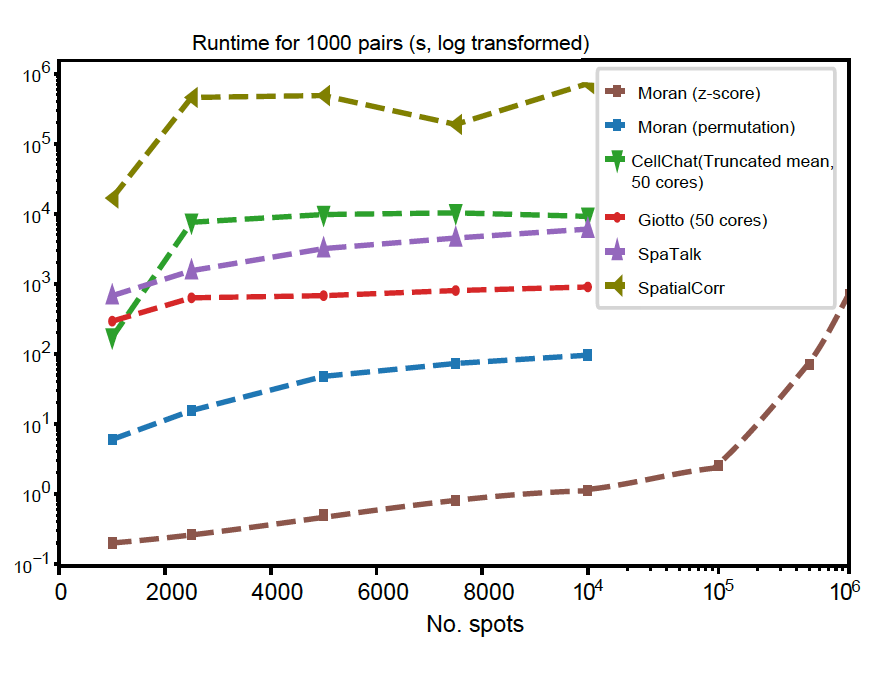
With the analytical testing method, SpatialDM is scalable to 1 million spots within 12 min with only one core.
It comprises two main steps: 1) global selection spatialdm_global to identify significantly interacting LR pairs; 2) local selection spatialdm_local to identify local spots for each interaction.
SpatialDM is available through PyPI.
To install, type the following command line and add -U for updates:
pip install -U SpatialDMAlternatively, you can install from this GitHub repository for latest (often development) version by the following command line:
pip install -U git+https://github.com/StatBiomed/SpatialDMInstallation time: < 1 min
Using the build-in melanoma dataset as an example, the following Python script will compute the p-value indicating whether a certain Ligand-Receptor is spatially co-expressed.
import spatialdm as sdm
adata = sdm.datasets.dataset.melanoma()
sdm.weight_matrix(adata, l=1.2, cutoff=0.2, single_cell=False) # weight_matrix by rbf kernel
sdm.extract_lr(adata, 'human', min_cell=3) # find overlapping LRs from CellChatDB
sdm.spatialdm_global(adata, 1000, specified_ind=None, method='both', nproc=1) # global Moran selection
sdm.sig_pairs(adata, method='permutation', fdr=True, threshold=0.1) # select significant pairs
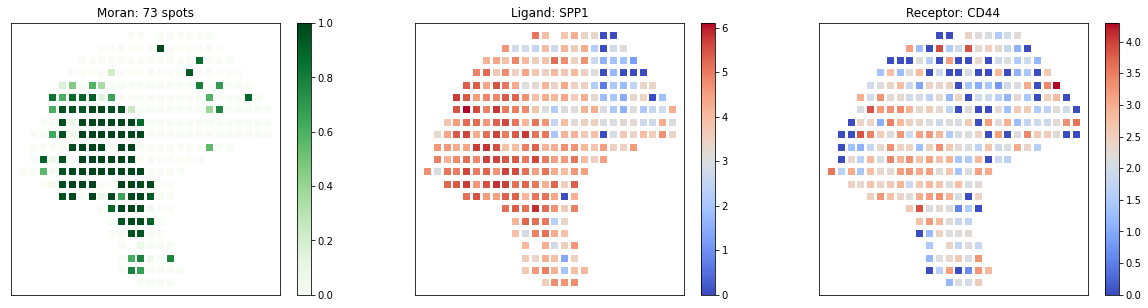
sdm.spatialdm_local(adata, n_perm=1000, method='both', specified_ind=None, nproc=1) # local spot selection
sdm.sig_spots(adata, method='permutation', fdr=False, threshold=0.1) # significant local spots
# visualize global and local pairs
import spatialdm.plottings as pl
pl.global_plot(adata, pairs=['SPP1_CD44'])
pl.plot_pairs(adata, ['SPP1_CD44'], marker='s')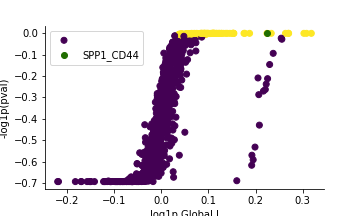
The full manual is at https://spatialdm.readthedocs.io, including:
- Permutation-based SpatialDM (Recommended for small datasets, <10k spots).
- Differential analyses of whole interactome among varying conditions.
SpatialDM manuscript with more details is available on bioRxiv now and is currently under review.