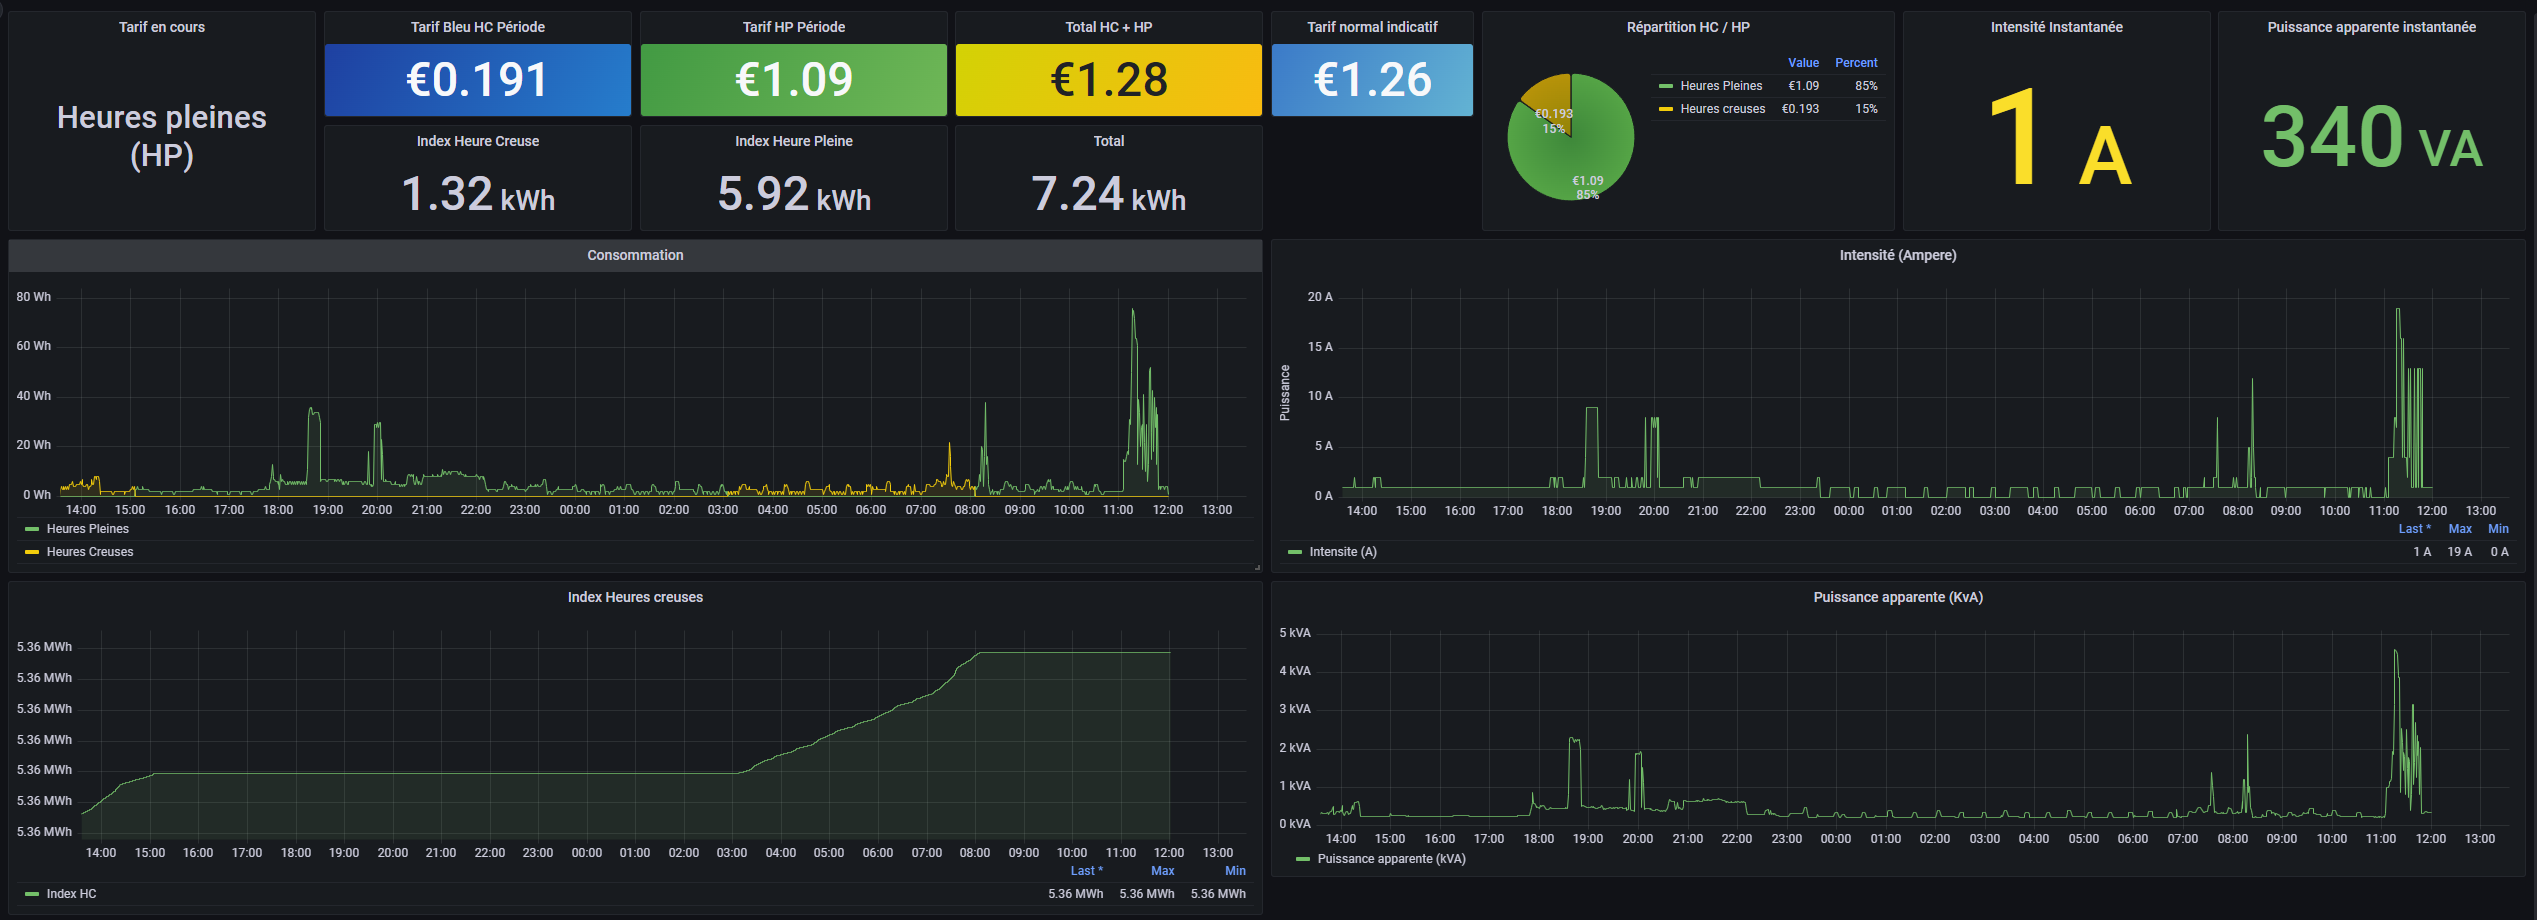
This repository aims at providing a power consumption monitoring of a Linky electricity meter.
The used Dongle is named "micro-teleinfo-v20" and available here.
- Connect Micro Teleinfo V2 dongle to the L1 & L2 connector of the Linky (the order as no influence)
- Connect Micro Teleinfo V2 dongle to the raspberry PI with USB
Following steps are not part of the doc and need to be done as pre requisites:
- Configure the network one the raspberry
- Configure the data
- Configure the timezone
Install picocom
apt install picocom
Check that the serial connection to the Linky is well captured by the dongle:
picocom -b 1200 -d 7 -p e -f n /dev/ttyUSB0
You should see this kind of output:
picocom v3.1

port is        : /dev/ttyUSB0
flowcontrol    : none
baudrate is    : 1200
parity is      : even
databits are   : 7
stopbits are   : 1
escape is      : C-a
local echo is  : no
noinit is      : no
noreset is     : no
hangup is      : no
nolock is      : no
send_cmd is    : sz -vv
receive_cmd is : rz -vv -E
imap is        :
omap is        :
emap is        : crcrlf,delbs,
logfile is     : none
initstring     : none
exit_after is  : not set
exit is        : no

Type [C-a] [C-h] to see available commands
Terminal ready
4 &
HCHP 000300819 (
PTEC HP..
IINST 002 Y
IMAX 090 H
PAPP 00500 &
HHPHC A ,
MOTDETAT 000000 B
ADCO XXXXXXXXXX A
OPTARIF HC.. <
ISOUSC 45 ?
HCHC 005337374 &
HCHP 000300820
PTEC HP..
IINST 002 Y
IMAX 090 H
PAPP 00500 &
HHPHC A ,
All fields are explained in the official Enedis doc.
INfluxdb is a time serie database. The tool will be in charge of saving the data retrieved by the Python script from the Dongle.
Install GPG key and the official package repository
wget -q -O - https://repos.influxdata.com/influxdb.key | gpg --dearmor | tee /usr/share/keyrings/influxdb-archive-keyring.gpg
echo "deb [signed-by=/usr/share/keyrings/influxdb-archive-keyring.gpg] https://repos.influxdata.com/debian $(lsb_release -cs) stable" > /etc/apt/sources.list.d/influxdb.list
Install
apt update && apt install influxdb
Enable and start the service
systemctl enable influxdb
systemctl start influxdb
The python script will read the information from the serial connection and insert in the influxdb database every metrics in time.
Install required libraries
apt install python3-pip
pip3 install pySerial influxdb
Clone the project in /home/pi
git clone [email protected]:Sispheor/teleinfo-linky-with-raspberry.git
Go into the folder and execute the script
cd teleinfo-linky-with-raspberry
python3 teleinfo.py
Let the script run for a couple minutes then press ctrl-c to stop it.
Then, check if the database has been updated. Run the influx client
influx
In the new prompt, connect the the database and print series
USE teleinfo
SHOW SERIES;
Output example:
influx
Connected to http:https://localhost:8086 version 1.8.10
InfluxDB shell version: 1.8.10
> USE teleinfo
Using database teleinfo
> SHOW SERIES;
key
---
HCHC,host=raspberry,region=linky
HCHP,host=raspberry,region=linky
HHPHC,host=raspberry,region=linky
IINST,host=raspberry,region=linky
IMAX,host=raspberry,region=linky
ISOUSC,host=raspberry,region=linky
MOTDETAT,host=raspberry,region=linky
OPTARIF,host=raspberry,region=linky
PAPP,host=raspberry,region=linky
PTEC,host=raspberry,region=linky
>
To install the script as a service that will be executing on each boot of the raspberry pi, create a service file in /etc/systemd/system/teleinfo.service with the following content:
[Unit]
Description = Run teleinfo python script
After = network.target

[Service]
Type = simple
ExecStart = python /home/pi/teleinfo-linky-with-raspberry/teleinfo.py
User = pi
Group = pi
Restart = on-failure
SyslogIdentifier = teleinfo
RestartSec = 5
TimeoutStartSec = infinity

[Install]
WantedBy = multi-user.target
Enable the service
systemctl daemon-reload
systemctl enable teleinfo.service
systemctl start teleinfo.service
Grafana is an analytics & monitoring solution for databases. It will be in charge of showing graph and interpretation of the retrieved data.
Install GPG key and the official package repository
wget -q -O - https://packages.grafana.com/gpg.key | gpg --dearmor | tee /usr/share/keyrings/grafana-archive-keyring.gpg
echo "deb [signed-by=/usr/share/keyrings/grafana-archive-keyring.gpg] https://packages.grafana.com/oss/deb stable main" > /etc/apt/sources.list.d/grafana.list
Install
apt update && apt install grafana
Start the Grafana server
systemctl enable grafana-server
systemctl start grafana-server
Connect to Grafana dashboard on the port 3000 of your Rpi. E.g: http:https://IP_RASPBERRY:3000.
- Go into Configuration -> Datasources
- Add an InfluxDB datasource with:
- URL: http:https://localhost:8086
- Database: teleinfo
Then import the grafana dashboard from the repo (grafana_dashboard_teleinfo.json):
- From the left menu selet import
- Browse files
- Select the
grafana_dashboard_teleinfo.jsonfile
Note: To change the KiloWatt per hour price, edit Dashboard variables from the top right corner.
The script will add a certain amount of data into the disk of the RPI everyday. To prevent a storage issue, you can create a retention policy on the database to automatically purge old data.
Run the influx client with influx. Then create a retention policy:
CREATE RETENTION POLICY "3_month" ON teleinfo DURATION 12w REPLICATION 1
For more info, refer to the influxdb doc.
Original script by https://github.com/SebastienReuiller/teleinfo-linky-with-raspberry Licensed under Apache License 2.0
