This project is a research project done for my master degree capstone. Stock market prices are hard to predict and it’s been an active research area for a while. Due to its financial gain it has attracted attentions from the academic and the business side. Building an accurate prediction model is still a challenging problem. It’s been known that stock market prices are largely driven by new information and it follows a random walk pattern as stated by the Efficient Market Hypothesis (EMH). Several people have attempted to extract patterns that effects stock market from different stimulant sources. Nevertheless, finding the best time to buy or sell a stock is a difficult task since many factors may influence the stock price.
- python
- nltk
- textblob
- pickle
- glob
- keras
- json
- sklearn
- numpy
- pandas
- tqdm
- csv
This framwork is to facilitate building machine learning models by organizing the project into layers.
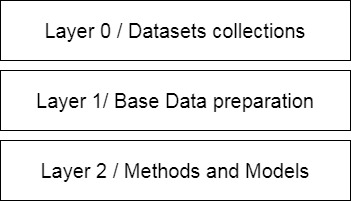
The CPL-D (Collect, Process, and Learn Data) model is made of 3 main layers
This layer is our collected dataset that we gathered either from the cloud, database, or gathered from external source. In here API’s or collecting tools are place and any tool, configuration, or scripts that works as information gathering. This is one of the core layers and work as the base for others because the hardest part usually in machine learning is to find the relevant data for the prediction task. When a prediction model is created and chose to be the most accurate model to use. This layer can also work as the base for the prediction model since it will get similar information as the ones used for training.
In here we start think of how would we create our base dataset that we will be used to create our methods. We consider our hypothesis and build a generalize dataset. Data preprocessing takes place in this layer. Where from layer 0 we might have 1,2, or even more dataset collected from different sources to supports our hypothesis and in this layer, we combine them and process them by doing text cleaning for text based tasks or such to fit a base shape dataset. This isn’t necessarily the dataset we load into our prediction model. From this dataset we can create other datasets to test our methods. Think of this dataset produced by this layer as a combined, organized, clean, and general dataset that we can produces subset data, or produce new data from. This layer output is a dataset where it can have all the information needed to derive methods from. It’s the base dataset where we can think of it as the features pool.
Here we create the subset dataset to test our hypothesis. The subset dataset is a method that can pick features from layer 1 dataset, create feature from other ones in the dataset, or expand features by using processing algorithms like TF-IDF for text processing. For each method different features are created to test. You can think of each feature choice as a different method because the results usually change for different feature choice. One method can use TF-IDF where the other one can use wrod2vec binary encoding, others can use different approach like word embedding. From those methods different training models are used to test the hypothesis. Also for each model an evaluation is made to see how good and accurate our model is. Then we can compare our model’s accuracy with each other to find which model and feature choice works the best.
The paper goes over the methods used and the results for this study.
Click HERE for the paper
Please use this citation to cite this work
Alarfaj, Salah. Stock Market Prediction. Github, 11 June 2018, github.com/SalN3t/MLStock.

