pySankey2 was developed to draw static Sankey diagrams based on matplotlib.
While the original version of pysankey was developed by anazalea et al. , this version only supports 2-layer Sankey diagrams, and the settable parameters are limited. pySankey2 expands the original version's functions to support multi-layer Sankey diagrams and allows user to set parameters more flexibly.
- v0.1.0
pysankey2-v0.1.0 is available at here, you can install locally via pip cmd after downloading:
pip install pysankey2-0.1.0.zip
- Development version
pip install git+https://github.com/SZJShuffle/pySankey2.git
Using a 2-layer demo fruits.txt:
| layer1 | layer2 |
|---|---|
| blueberry | blueberry |
| apple | blueberry |
| ... | ... |
| orange | orange |
and just with a simple code:
import matplotlib.pyplot as plt
import pandas as pd
from pysankey2.datasets import load_fruits
from pysankey2 import Sankey

df = load_fruits()
sky = Sankey(df,colorMode="global")
fig,ax = sky.plot()
Setting the strip color to be the same with left box is also allowed:
import matplotlib.pyplot as plt
import pandas as pd
from pysankey2.datasets import load_fruits
from pysankey2.utils import setColorConf
from pysankey2 import Sankey

df = load_fruits()
fruits = list(set(df.layer1).union(set(df.layer2)))

# Specified the colors.
# Here, we use 'Pastel1' colormaps(a shy but fresh palette:)).
# See matplotlib cmap for more colormaps:
# https://matplotlib.org/3.1.0/tutorials/colors/colormaps.html
colors = setColorConf(len(fruits),colors='Pastel1')
cls_map = dict(zip(fruits,colors))

# set stripColor="left"
sky = Sankey(df,colorDict=cls_map,colorMode="global",stripColor='left')

# set a bigger font size
fig,ax = sky.plot(text_kws={'size':20})
we get:
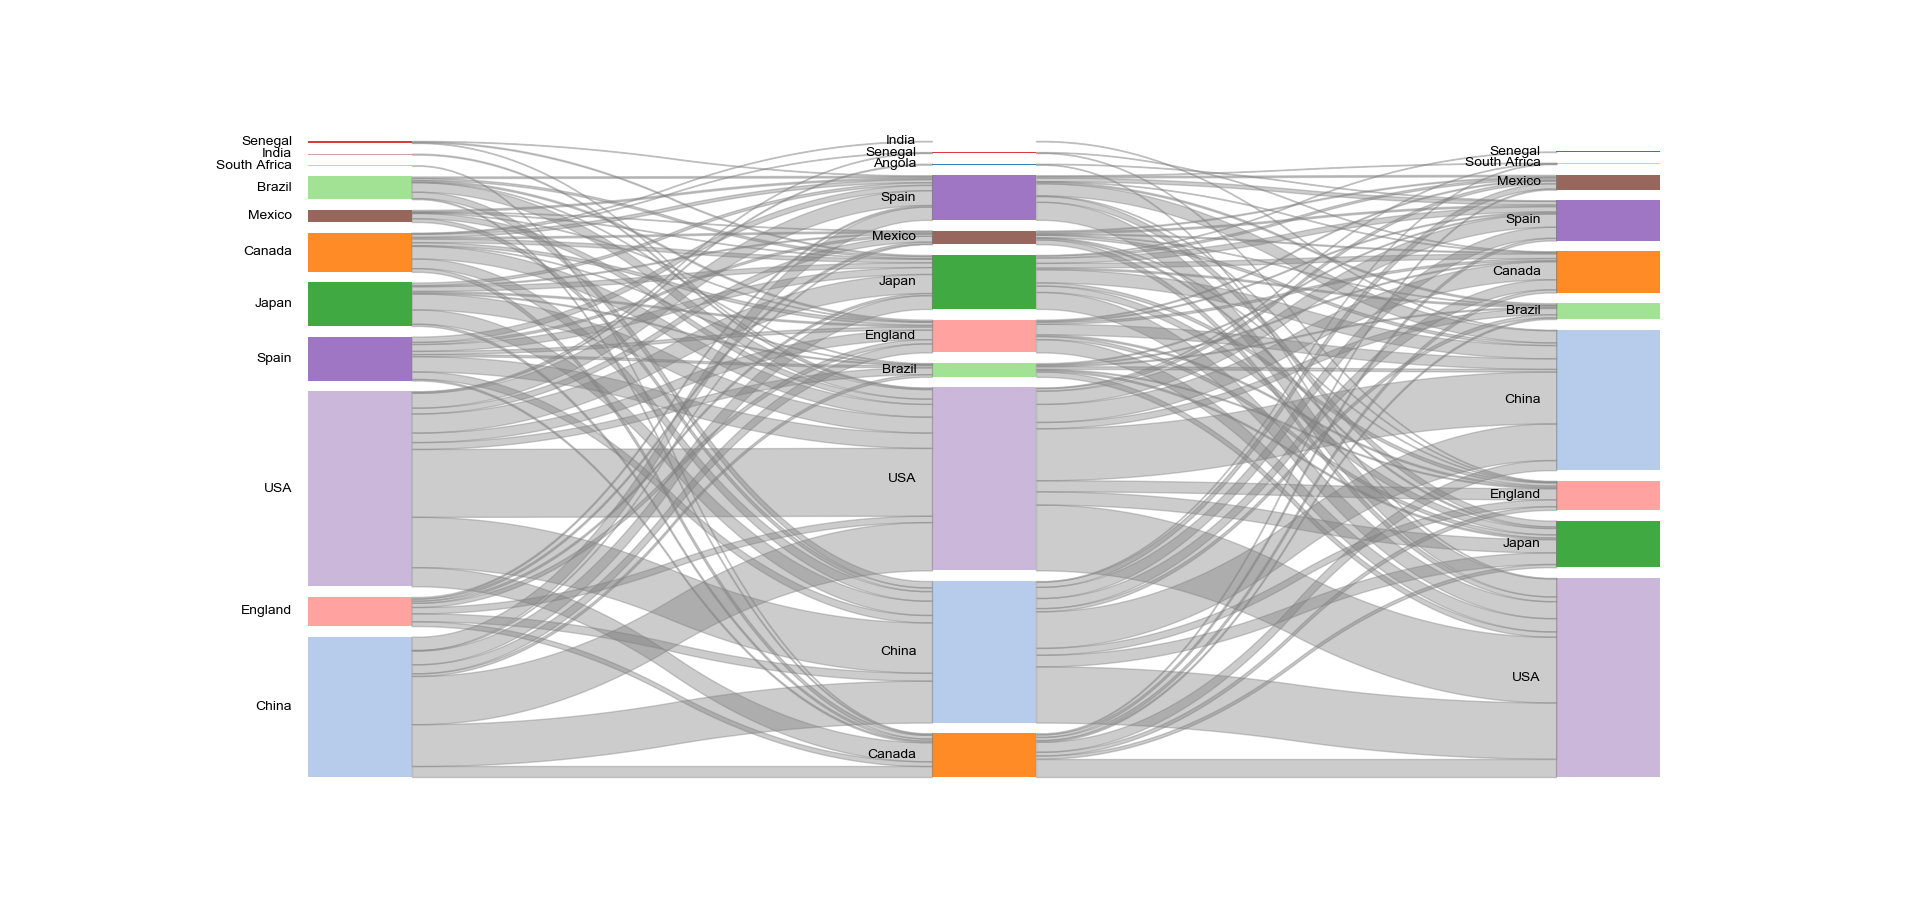
Using a 3-layer demo countrys.txt:
| layer1 | layer2 | layer3 |
|---|---|---|
| China | Canada | USA |
| England | China | Japan |
| ... | ... | ... |
| Senegal | Spain | USA |
and with a simple code:
from pysankey2 import Sankey
from pysankey2.datasets import load_countrys

df = load_countrys()
sky_auto_global_colors = Sankey(df,colorMode="global")
fig,ax = sky_auto_global_colors.plot()
we get:
For a more detailed tutorial, please refer to:pysankey2_demo
Any questions, bugs or suggestions are welcome, please feel free to contact: [email protected]


