A minimal Python library to draw customized maps from OpenStreetMap created using the osmnx, matplotlib, shapely and vsketch packages.
This work is licensed under a GNU Affero General Public License v3.0 (you can make commercial use, distribute and modify this project, but must disclose the source code with the license and copyright notice)
- Please keep the printed message on the figures crediting my repository and OpenStreetMap (mandatory by their license).
- I am personally against NFTs for their environmental impact, the fact that they're a giant money-laundering pyramid scheme and the structural incentives they create for theft in the open source and generative art communities.
- I do not authorize in any way this project to be used for selling NFTs, although I cannot legally enforce it. Respect the creator.
- The AeternaCivitas and geoartnft projects have used this work to sell NFTs and refused to credit it. See how they reacted after being exposed: AeternaCivitas, geoartnft.
- I have closed my other generative art projects on Github and won't be sharing new ones as open source to protect me from the NFT community.
As seen on Hacker News:
OBS. I'm trying to solve a dependency issue with vsketch before publishing prettymaps v0.1.3, so, for now, please install directly from GitHub.
Install prettymaps with:
pip install git+https://github.com/marceloprates/prettymaps
Install prettymaps with:
!pip install -e "git+https://github.com/marceloprates/prettymaps#egg=prettymaps"
Then restart the runtime (Runtime -> Restart Runtime) before importing prettymaps
Plotting with prettymaps is very simple. Run:
prettymaps.plot(your_query)your_query can be:
- An address (Example: "Porto Alegre"),
- Latitude / Longitude coordinates (Example: (-30.0324999, -51.2303767))
- A custom boundary in GeoDataFrame format
import prettymaps

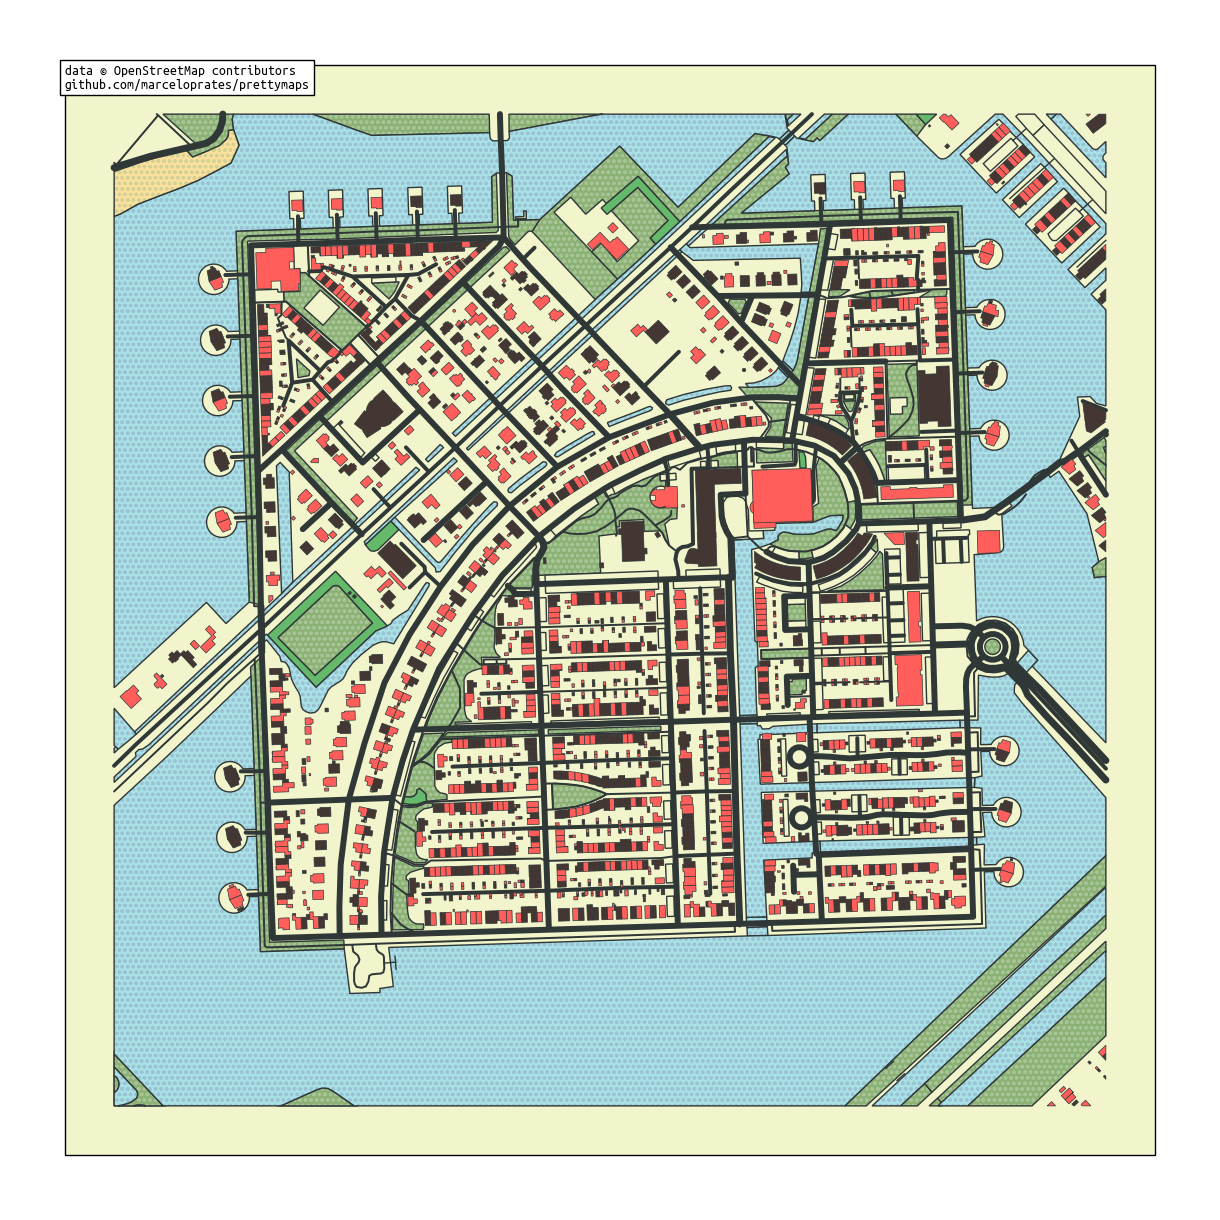
plot = prettymaps.plot('Stad van de Zon, Heerhugowaard, Netherlands')
You can also choose from different "presets" (parameter combinations saved in JSON files)
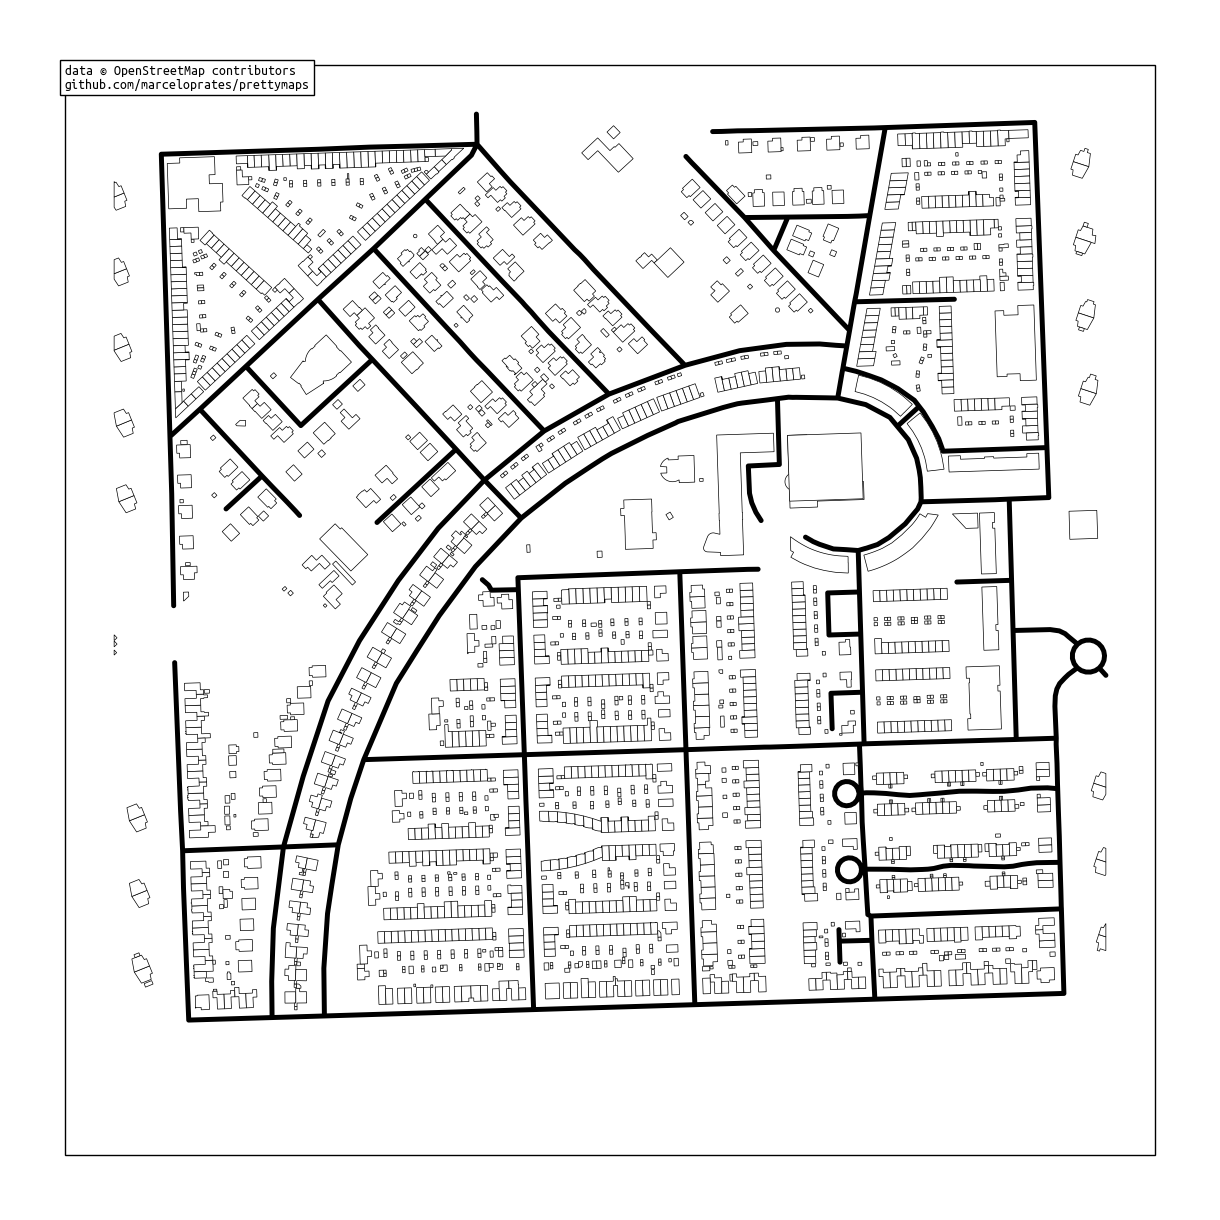
See below an example using the "minimal" preset
plot = prettymaps.plot(
    'Stad van de Zon, Heerhugowaard, Netherlands',
    preset = 'minimal'
)
Run
prettymaps.presets()to list all available presets:
| preset | params | |
|---|---|---|
| 0 | barcelona | {'layers': {'perimeter': {'circle': False}, 's... |
| 1 | barcelona-plotter | {'layers': {'streets': {'width': {'primary': 5... |
| 2 | cb-bf-f | {'layers': {'streets': {'width': {'trunk': 6, ... |
| 3 | default | {'layers': {'perimeter': {}, 'streets': {'widt... |
| 4 | heerhugowaard | {'layers': {'perimeter': {}, 'streets': {'widt... |
| 5 | macao | {'layers': {'perimeter': {}, 'streets': {'cust... |
| 6 | minimal | {'layers': {'perimeter': {}, 'streets': {'widt... |
| 7 | tijuca | {'layers': {'perimeter': {}, 'streets': {'widt... |
To examine a specific preset, run:
prettymaps.preset('default')| layers | style | circle | radius | |
|---|---|---|---|---|
| perimeter | {} |
fill: false lw: 0 zorder: 0 |
null ... |
500 ... |
| streets | width: cycleway: 3.5 footway: 1 motorway: 5 pedestrian: 2 primary: 4.5 residential: 3 secondary: 4 service: 2 tertiary: 3.5 trunk: 5 unclassified: 2 |
alpha: 1 ec: '#475657' fc: '#2F3737' lw: 0 zorder: 4 |
||
| building | tags: building: true landuse: construction |
ec: '#2F3737' lw: 0.5 palette: - '#433633' - '#FF5E5B' zorder: 5 |
||
| water | tags: natural: - water - bay |
ec: '#2F3737' fc: '#a8e1e6' hatch: ooo... hatch_c: '#9bc3d4' lw: 1 zorder: 3 |
||
| forest | tags: landuse: forest |
ec: '#2F3737' fc: '#64B96A' lw: 1 zorder: 2 |
||
| green | tags: landuse: - grass - orchard leisure: park natural: - island - wood |
ec: '#2F3737' fc: '#8BB174' hatch: ooo... hatch_c: '#A7C497' lw: 1 zorder: 1 |
||
| beach | tags: natural: beach |
ec: '#2F3737' fc: '#FCE19C' hatch: ooo... hatch_c: '#d4d196' lw: 1 zorder: 3 |
||
| parking | tags: amenity: parking highway: pedestrian man_made: pier |
ec: '#2F3737' fc: '#F2F4CB' lw: 1 zorder: 3 |
||
| background | .nan ... |
fc: '#F2F4CB' zorder: -1 |
Insted of using the default configuration you can customize several parameters. The most important are:
- layers: A dictionary of OpenStreetMap layers to fetch.
- Keys: layer names (arbitrary)
- Values: dicts representing OpenStreetMap queries
- style: Matplotlib style parameters
- Keys: layer names (the same as before)
- Values: dicts representing Matplotlib style parameters
plot = prettymaps.plot(
    # Your query. Example: "Porto Alegre" or (-30.0324999, -51.2303767) (GPS coords)
    your_query,
    # Dict of OpenStreetMap Layers to plot. Example:
    # {'building': {'tags': {'building': True}}, 'water': {'tags': {'natural': 'water'}}}
    # Check the /presets folder for more examples
    layers,
    # Dict of style parameters for matplotlib. Example:
    # {'building': {'palette': ['#f00','#0f0','#00f'], 'edge_color': '#333'}}
    style,
    # Preset to load. Options include:
    # ['default', 'minimal', 'macao', 'tijuca']
    preset,
    # Save current parameters to a preset file.
    # Example: "my-preset" will save to "presets/my-preset.json"
    save_preset,
    # Whether to update loaded preset with additional provided parameters. Boolean
    update_preset,
    # Plot with circular boundary. Boolean
    circle,
    # Plot area radius. Float
    radius,
    # Dilate the boundary by this amount. Float
    dilate
)
plot is a python dataclass containing:
@dataclass
class Plot:
    # A dictionary of GeoDataFrames (one for each plot layer)
    geodataframes: Dict[str, gp.GeoDataFrame]
    # A matplotlib figure
    fig: matplotlib.figure.Figure
    # A matplotlib axis object
    ax: matplotlib.axes.Axes
Here's an example of running prettymaps.plot() with customized parameters:
plot = prettymaps.plot(
    'Praça Ferreira do Amaral, Macau',
    circle = True,
    radius = 1100,
    layers = {
        "green": {
            "tags": {
                "landuse": "grass",
                "natural": ["island", "wood"],
                "leisure": "park"
            }
        },
        "forest": {
            "tags": {
                "landuse": "forest"
            }
        },
        "water": {
            "tags": {
                "natural": ["water", "bay"]
            }
        },
        "parking": {
            "tags": {
                "amenity": "parking",
                "highway": "pedestrian",
                "man_made": "pier"
            }
        },
        "streets": {
            "width": {
                "motorway": 5,
                "trunk": 5,
                "primary": 4.5,
                "secondary": 4,
                "tertiary": 3.5,
                "residential": 3,
            }
        },
        "building": {
            "tags": {"building": True},
        },
    },
    style = {
        "background": {
            "fc": "#F2F4CB",
            "ec": "#dadbc1",
            "hatch": "ooo...",
        },
        "perimeter": {
            "fc": "#F2F4CB",
            "ec": "#dadbc1",
            "lw": 0,
            "hatch": "ooo...",
        },
        "green": {
            "fc": "#D0F1BF",
            "ec": "#2F3737",
            "lw": 1,
        },
        "forest": {
            "fc": "#64B96A",
            "ec": "#2F3737",
            "lw": 1,
        },
        "water": {
            "fc": "#a1e3ff",
            "ec": "#2F3737",
            "hatch": "ooo...",
            "hatch_c": "#85c9e6",
            "lw": 1,
        },
        "parking": {
            "fc": "#F2F4CB",
            "ec": "#2F3737",
            "lw": 1,
        },
        "streets": {
            "fc": "#2F3737",
            "ec": "#475657",
            "alpha": 1,
            "lw": 0,
        },
        "building": {
            "palette": [
                "#FFC857",
                "#E9724C",
                "#C5283D"
            ],
            "ec": "#2F3737",
            "lw": 0.5,
        }
    }
)
In order to plot an entire region and not just a rectangular or circular area, set
radius = Falseplot = prettymaps.plot(
'Bom Fim, Porto Alegre, Brasil', radius = False,
)You can access layers's GeoDataFrames directly like this:
# Run prettymaps in show = False mode (we're only interested in obtaining the GeoDataFrames)
plot = prettymaps.plot('Centro Histórico, Porto Alegre', show = False)
plot.geodataframes['building']| addr:housenumber | addr:street | amenity | operator | website | geometry | addr:postcode | name | office | opening_hours | ... | contact:phone | bus | public_transport | source:name | government | ways | name:fr | type | building:part | architect | ||
|---|---|---|---|---|---|---|---|---|---|---|---|---|---|---|---|---|---|---|---|---|---|---|
| element_type | osmid | |||||||||||||||||||||
| node | 2407915698 | 820 | Rua Washington Luiz | NaN | NaN | NaN | POINT (-51.23212 -30.03670) | 90010-460 | NaN | NaN | NaN | ... | NaN | NaN | NaN | NaN | NaN | NaN | NaN | NaN | NaN | NaN |
| way | 126665330 | 387 | Rua dos Andradas | place_of_worship | NaN | NaN | POLYGON ((-51.23518 -30.03275, -51.23512 -30.0... | 90020-002 | Igreja Nossa Senhora das Dores | NaN | NaN | ... | NaN | NaN | NaN | NaN | NaN | NaN | NaN | NaN | NaN | NaN |
| 126665331 | 1001 | Rua dos Andradas | NaN | NaN | https://www.ruadapraiashopping.com.br | POLYGON ((-51.23167 -30.03066, -51.23160 -30.0... | 90020-015 | Rua da Praia Shopping | NaN | Mo-Fr 09:00-21:00; Sa 08:00-20:00 | ... | NaN | NaN | NaN | NaN | NaN | NaN | NaN | NaN | NaN | NaN | |
| 129176990 | 1020 | Rua 7 de Setembro | NaN | NaN | https://www.memorial.rs.gov.br | POLYGON ((-51.23117 -30.02891, -51.23120 -30.0... | 90010-191 | Memorial do Rio Grande do Sul | NaN | Tu-Sa 10:00-18:00 | ... | NaN | NaN | NaN | NaN | NaN | NaN | NaN | NaN | NaN | NaN | |
| 129176991 | NaN | Praça da Alfândega | NaN | NaN | https://www.margs.rs.gov.br | POLYGON ((-51.23153 -30.02914, -51.23156 -30.0... | 90010-150 | Museu de Arte do Rio Grande do Sul | NaN | Tu-Su 10:00-19:00 | ... | NaN | NaN | NaN | NaN | NaN | NaN | NaN | NaN | NaN | NaN | |
| ... | ... | ... | ... | ... | ... | ... | ... | ... | ... | ... | ... | ... | ... | ... | ... | ... | ... | ... | ... | ... | ... | ... |
| relation | 6760281 | NaN | NaN | NaN | NaN | NaN | POLYGON ((-51.23238 -30.03337, -51.23223 -30.0... | NaN | NaN | NaN | NaN | ... | NaN | NaN | NaN | NaN | NaN | [457506887, 457506886] | NaN | multipolygon | NaN | NaN |
| 6760282 | NaN | NaN | NaN | NaN | NaN | POLYGON ((-51.23203 -30.03340, -51.23203 -30.0... | NaN | Atheneu Espírita Cruzeiro do Sul | NaN | NaN | ... | NaN | NaN | NaN | NaN | NaN | [457506875, 457506889, 457506888] | NaN | multipolygon | NaN | NaN | |
| 6760283 | NaN | NaN | NaN | NaN | NaN | POLYGON ((-51.23284 -30.03367, -51.23288 -30.0... | NaN | Palacete Chaves | NaN | NaN | ... | NaN | NaN | NaN | NaN | NaN | [457506897, 457506896] | NaN | multipolygon | NaN | Theodor Wiederspahn | |
| 6760284 | NaN | NaN | NaN | NaN | NaN | POLYGON ((-51.23499 -30.03412, -51.23498 -30.0... | NaN | NaN | NaN | NaN | ... | NaN | NaN | NaN | NaN | NaN | [457506910, 457506913] | NaN | multipolygon | NaN | NaN | |
| 14393526 | 1044 | Rua Siqueira Campos | NaN | NaN | https://www.sefaz.rs.gov.br | POLYGON ((-51.23125 -30.02813, -51.23128 -30.0... | NaN | Secretaria Estadual da Fazenda | NaN | NaN | ... | NaN | NaN | NaN | NaN | NaN | [236213286, 1081974882] | NaN | multipolygon | NaN | NaN |
2423 rows × 105 columns
Search a building by name and display it:
plot.geodataframes['building'][
        plot.geodataframes['building'].name == 'Catedral Metropolitana Nossa Senhora Mãe de Deus'
].geometry[0]
Plot mosaic of building footprints
import numpy as np
import osmnx as ox
from matplotlib import pyplot as plt
from matplotlib.font_manager import FontProperties

# Run prettymaps in show = False mode (we're only interested in obtaining the GeoDataFrames)
plot = prettymaps.plot('Porto Alegre', show = False)
# Get list of buildings from plot's geodataframes dict
buildings = plot.geodataframes['building']
# Project from lat / long
buildings = ox.project_gdf(buildings)
buildings = [b for b in buildings.geometry if b.area > 0]

# Draw Matplotlib mosaic of n x n building footprints
n = 6
fig,axes = plt.subplots(n,n, figsize = (7,6))
# Set background color
fig.patch.set_facecolor('#5cc0eb')
# Figure title
fig.suptitle(
    'Buildings of Porto Alegre',
    size = 25,
    color = '#fff',
    fontproperties = FontProperties(fname = '../assets/PermanentMarker-Regular.ttf')
)
# Draw each building footprint on a separate axis
for ax,building in zip(np.concatenate(axes),buildings):
    ax.plot(*building.exterior.xy, c = '#ffffff')
    ax.autoscale(); ax.axis('off'); ax.axis('equal')
Access plot.ax or plot.fig to add new elements to the matplotlib plot:
from matplotlib.font_manager import FontProperties

plot = prettymaps.plot(
    (41.39491,2.17557),
    preset = 'barcelona',
)

# Change background color
plot.fig.patch.set_facecolor('#F2F4CB')
# Add title
plot.ax.set_title(
    'Barcelona',
    fontproperties = FontProperties(
        fname = '../assets/PermanentMarker-Regular.ttf',
        size = 50
    )
)

plt.show()
Use plotter mode to export a pen plotter-compatible SVG (thanks to abey79's amazing vsketch library)
plot = prettymaps.plot(
    (41.39491,2.17557),
    mode = 'plotter',
    layers = dict(perimeter = {}),
    preset = 'barcelona-plotter',
    scale_x = .6,
    scale_y = -.6,
)
Some other examples
plot = prettymaps.plot(
    # City name
    'Barra da Tijuca',
    dilate = 0,
    figsize = (22,10),
    preset = 'tijuca',
)
plot = prettymaps.plot(
'Stad van de Zon, Heerhugowaard, Netherlands',
preset = 'heerhugowaard',
)Use prettymaps.create_preset() to create a preset:
prettymaps.create_preset(
    "my-preset",
    layers = {
        "building": {
            "tags": {
                "building": True,
                "leisure": [
                    "track",
                    "pitch"
                ]
            }
        },
        "streets": {
            "width": {
                "trunk": 6,
                "primary": 6,
                "secondary": 5,
                "tertiary": 4,
                "residential": 3.5,
                "pedestrian": 3,
                "footway": 3,
                "path": 3
            }
        },
    },
    style = {
        "perimeter": {
            "fill": False,
            "lw": 0,
            "zorder": 0
        },
        "streets": {
            "fc": "#F1E6D0",
            "ec": "#2F3737",
            "lw": 1.5,
            "zorder": 3
        },
        "building": {
            "palette": [
                "#fff"
            ],
            "ec": "#2F3737",
            "lw": 1,
            "zorder": 4
        }
    }
)

prettymaps.preset('my-preset')| layers | style | circle | radius | dilate | |
|---|---|---|---|---|---|
| building | tags: building: true leisure: - track - pitch |
ec: '<span style="background-color:#2F3737; color:#fff">#2F3737' lw: 1 palette: - '#fff' zorder: 4 |
null ... |
null ... |
null ... |
| streets | width: footway: 3 path: 3 pedestrian: 3 primary: 6 residential: 3.5 secondary: 5 tertiary: 4 trunk: 6 |
ec: '#2F3737' fc: '#F1E6D0' lw: 1.5 zorder: 3 |
|||
| perimeter | .nan ... |
fill: false lw: 0 zorder: 0 |
Use prettymaps.delete_preset() to delete presets:
# Show presets before deletion
print('Before deletion:')
display(prettymaps.presets())
# Delete 'my-preset'
prettymaps.delete_preset('my-preset')
# Show presets after deletion
print('After deletion:')
display(prettymaps.presets())
Before deletion:
| preset | params | |
|---|---|---|
| 0 | barcelona | {'layers': {'perimeter': {'circle': False}, 's... |
| 1 | barcelona-plotter | {'layers': {'streets': {'width': {'primary': 5... |
| 2 | cb-bf-f | {'layers': {'streets': {'width': {'trunk': 6, ... |
| 3 | default | {'layers': {'perimeter': {}, 'streets': {'widt... |
| 4 | heerhugowaard | {'layers': {'perimeter': {}, 'streets': {'widt... |
| 5 | macao | {'layers': {'perimeter': {}, 'streets': {'cust... |
| 6 | minimal | {'layers': {'perimeter': {}, 'streets': {'widt... |
| 7 | my-preset | {'layers': {'building': {'tags': {'building': ... |
| 8 | tijuca | {'layers': {'perimeter': {}, 'streets': {'widt... |
After deletion:
| preset | params | |
|---|---|---|
| 0 | barcelona | {'layers': {'perimeter': {'circle': False}, 's... |
| 1 | barcelona-plotter | {'layers': {'streets': {'width': {'primary': 5... |
| 2 | cb-bf-f | {'layers': {'streets': {'width': {'trunk': 6, ... |
| 3 | default | {'layers': {'perimeter': {}, 'streets': {'widt... |
| 4 | heerhugowaard | {'layers': {'perimeter': {}, 'streets': {'widt... |
| 5 | macao | {'layers': {'perimeter': {}, 'streets': {'cust... |
| 6 | minimal | {'layers': {'perimeter': {}, 'streets': {'widt... |
| 7 | tijuca | {'layers': {'perimeter': {}, 'streets': {'widt... |
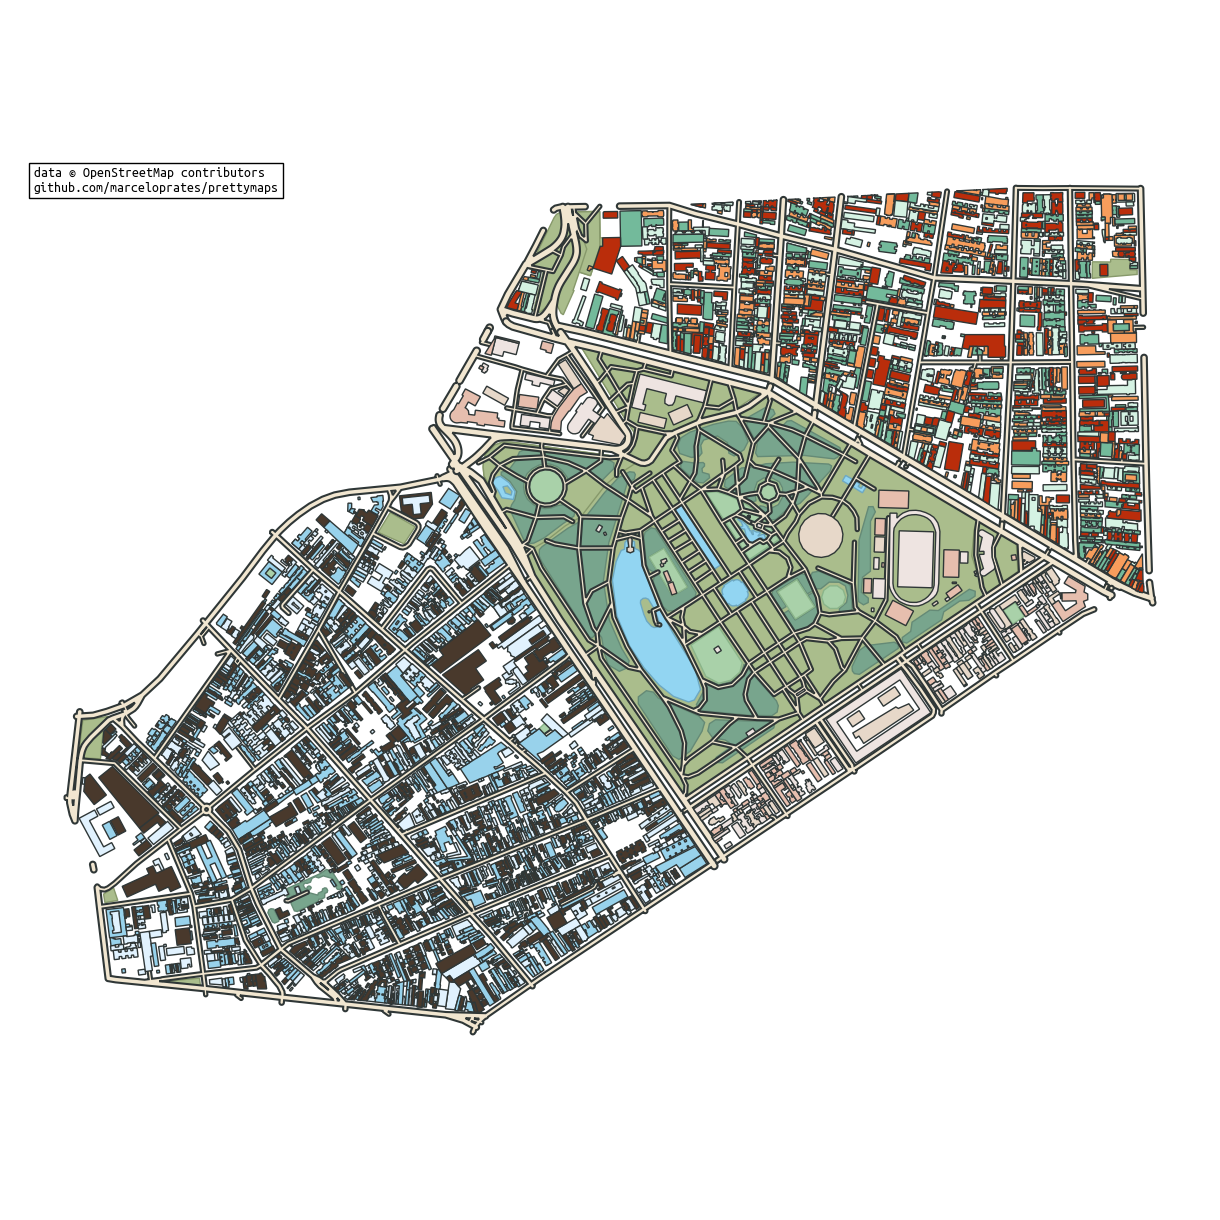
Use prettymaps.multiplot and prettymaps.Subplot to draw multiple regions on the same canvas
# Draw several regions on the same canvas
prettymaps.multiplot(
    prettymaps.Subplot(
        'Cidade Baixa, Porto Alegre',
        style={'building': {'palette': ['#49392C', '#E1F2FE', '#98D2EB']}}
    ),
    prettymaps.Subplot(
        'Bom Fim, Porto Alegre',
        style={'building': {'palette': ['#BA2D0B', '#D5F2E3', '#73BA9B', '#F79D5C']}}
    ),
    prettymaps.Subplot(
        'Farroupilha, Porto Alegre',
        style={'building': {'palette': ['#EEE4E1', '#E7D8C9', '#E6BEAE']}}
    ),
    # Load a global preset
    preset='cb-bf-f',
    # Figure size
    figsize=(12, 12)
)


